A Treatment of the Inherited Determinants
of Disparity in School Product
By
RAYMOND FRANZEN
A.B. (Harvard), M.A. (Columbia)
Ph.D. (Columbia)
Teachers College, Columbia University
Contributions to Education, No. 125
Published by
Teachers College, Columbia University
New York City
1922
Copyright, 1922, by Raymond Franzen
The results of the experiment reported here have become so much a portion of my process of reasoning that duplication of material presented elsewhere is unavoidable. I wish in particular to recognize my indebtedness to the Teachers College Record for permission to reprint here revised portions of an article which appeared in the November, 1920, number of that journal. I will warn here any reader to whom the intricacies of a full statistical account are irksome that the logic and conclusions presented in this study are incorporated in a more palatable and abbreviated form in Chapter IV of Intelligence Tests and School Reorganization (World Book Company).
The work presented here has been made possible by the cooperation and interest of the two principals of the Garden City public school during the period of my work there, Miss Gladys Locke and Mrs. Edna Maule. I also owe any success that this experiment may have had to the teachers who did the real work of “pushing” abilities to their limit. My indebtedness to Gladys Locke Franzen for help in expression and correction is surpassed only by what I credit to her encouragement and cooperation at its inception.
During the period in which this experiment was planned and executed it grew into a real problem through the advice of two of my teachers to whom I owe all such inspiration and knowledge as I possess—Edward L. Thorndike and Truman L. Kelley.
Raymond H. Franzen
Des Moines, Iowa, 1922.
| I. | An Outline of the Experiment | 1 |
| The Use of Quotients and Ratios | ||
| The Derivation of Age Norms | ||
| A Method of Survey of Reading, Language and Arithmetic | ||
| II. | Statistical Treatment of the Experiment | 17 |
| The Quotients | ||
| The Ratios | ||
| Summary | ||
| III. | The Psychological Conclusions of the Experiment | 43 |
| The Neglect of Genius | ||
| Is Genius Specialized? | ||
| Current Psychological Opinion | ||
| Conclusions |
[1]
Standardized measurement of educational product has won its way to a recognized place in the school life of this country. Many of our larger cities have research bureaus of tests and measurements, and advanced private schools have departments of measurement. The logic of the use of statistically derived evaluations versus the use of opinion, swayed as it is by the haphazard captions of emotion and condition, has become widely recognized. The case of scientific measurement in education has been argued and won. The objections to older forms of measurement have become the criteria of the value of the new.
Still administrators, although they have been convinced theoretically of its importance, find it hard to see just what measurement does for their schools. They often object that measurements are made, the tests are carried away by the examiner, and some time later they are presented with a neat series of distributions and are told where their school stands in relation to certain other schools or to schools in general. This is undoubtedly a very important piece of information; since a determination of the extent to which a goal has been attained forms the basis of the commendation or condemnation of the methods, curricula, and text-books employed in the process. But administrators want to know which of the various elements of school procedure are to be praised and which are to be blamed.
We cannot condemn or support a whole school system on the basis of composite results (unless all possible educational objectives have been measured, and show one common drift; or unless it is necessary that the system fall or stand as a whole) since then we should be throwing good and bad into a common discard. We must measure each thing separately. We must build our ideal system of education synthetically, taking the best methods from each of the [2]prevalent groups of theories. There has been too much absolutism in education, too little of a realism that sees the good and bad in all and diminishes the bad and augments the good. If we adopt this point of view we become really empirical in our method, living through each educational experiment to incorporate it into a growing treasury of tested theory, not deducing success or failure from metaphysical or doctrinaire prejudice. In this administrators have been more scientific than those who measure. They have always objected that they wanted differential diagnoses. Here the answer to their needs must come through experimentation and it is only through nation-wide study and careful comparison and integration of results that methods of teaching can be scientifically established.
Three uses of measurement commonly stressed are: (1) Diagnosis of degree of attainment of goal; (2) selection of method of attainment of goal; (3) definitive outline of goals. We have seen that the first two are of little immediate value to the administrator. The first only gives him an accurate notion of where he stands in any one subject without pretending to tell him why; the second is a promissory note. Some day we shall be able to tell him the best methods for the attainment of his goal. The third has slightly more immediate value. Measurement splits up the goals of education, gives them concrete formulation, allows teachers to see an advance in the class in one function as separate from the rest; allows them, for instance, to distinguish more clearly than they otherwise would between oral reading and silent reading, or between addition and division. But this, too, is rather too general to appeal to administrative economy. One would find it very difficult to sell one’s services as a measurer to a school board or a superintendent on the basis of these three values. They answer that universities and scientific research give them as much as they want of these values. What an expert on measurement could add in interpretation of results would seem of small additional value to them.
Still there is a very marked function that such an expert can perform; but he must serve a fourth and fifth use of measurement while he serves a particular school. When he serves the first three he is serving the science of education and, unfortunately, no one school will pay him to do that. The uses of measurement that directly benefit any one school are: (4) Classification by information [3]and intelligence and (5) diagnosis of individual disability. For the proper prosecution of these aims individual measurements and age norms are essential. Only with such equipment can we make the prognoses of future school behavior which the administrator so urgently needs.
Grade norms cannot be used to make individual diagnoses. Though we can see by them which children are below and which above the level that in their grade they should attain, we cannot see just what administrators most need to know; namely, whether the retardation and acceleration are justified or not—how many children are working at maximum. More than that, computations based on grade norms are very inaccurate in individual cases because the variability within any grade is so great. As it becomes necessary to use new norms for such purposes it is important to have them in terms that are directly comparable to intelligence mensuration.[2]
First in importance is an interpretation of the meaning of an Intelligence Quotient. Too often it is stated as a number and left as a number with the belief that somehow or other that is a tag which carries its own divine implication. Its importance lies in its diagnosis of power of adaptation, and it has a high correlation with the maximum possible rate of school progress. Just as a pure information test diagnoses the neural bonds that have been formed in any one field, so an intelligence test diagnoses the ability to form bonds, to meet a new situation and form satisfactory habits—power to learn. It may be thought of as a diagnosis of the neural chemistry of the individual. As such it is not concerned with the connections or quantity, but rather with the quality of the neural tissue.
[4]
As an intelligence quotient is actual mental age divided by chronological age—which is the normal mental level of the child’s age-group—so it is the rate at which the child has progressed to mental maturity. It is his potential rate of progress. It is a division of what is by what normally would be. Then, when we use IQ we express the various degrees of power of adaptation due to various degrees of fitness of neural equipment to form bonds, by means of a diagnosis of the rate of formation of bonds which everyone forms sooner or later in an environment such as ours. It is conceivable that we might test this same power without testing the presence of such bonds at all. Such a test would detect directly the quality of the neural equipment irrespective of quantity or conformation.
A ten-year-old child whose mental age is ten has progressed at the rate which is normal, and his IQ is 1.00. A very exceptional ten-year-old child whose mental age is fifteen has progressed just one and one half times as fast as the former, and his IQ is 1.50. Another exceptional ten-year-old child whose mental age is five has progressed at just one-half the rate of the first, and his IQ is .50. What we mean, then, by an Intelligence Quotient is the rate at which a child grows to the mental maturity of human beings in the world as it is.
For purposes of presentation of a problem one can here assume (an hypothesis the value of which will here be determined) that each child can attain this rate of progress in each of the elementary school subjects. The degree to which this is true is the degree to which the IQ is a valid index of power to deal with school subjects. This assumes that inherited special disabilities in the school subjects are uncommon, that school progress is determined by the interplay of intelligence and environment, and that so-called interest characteristics which aid in development are the result of an earlier interplay of intelligence and environment. The degree to which educational product of children can be made to approach this intelligence will allow us to judge how far these factors are inherited, since differences that are removable must be learned, not innate.
We can the more readily see the significance of viewing a child’s equipment in terms of educational and mental age, when we conceive of a Subject Quotient. This is a quotient resulting from the division of the age level reached in the test in question by the [5]chronological age of the pupil. It is a measure of the rate of progress of the child in the school subject under consideration. Thus a ten-year-old child with ten-year-old ability in Thorndike Reading Scale Alpha 2 would have as his reading age divided by chronological age, 1.00. This may be called his Subject Quotient in Reading or his Reading Quotient. The division of what is by what would be if the child were normal gives the percentage of normality, the actual rate of progress. Since the IQ is the potential rate of progress and the SQ the actual rate of progress, the ratio of SQ to IQ gives the percentage of what that child could do, that he has actually done. Thus a child with an IQ of 1.32 whose reading quotient (his RQ) is 1.10, though he is doing work which is above normal, is not doing work which is above normal for him. His RQ/IQ is 1.10/1.32, whereas if he were progressing at his optimum rate it would equal 1.32/1.32. This RQ/IQ is the same quantity as RA/MA. We may call this a Subject Ratio and the average of Subject Ratios an Accomplishment Ratio. We could, if the absolute association between reading age and mental age were perfect, measure the approximation to ideal educational performance of any one child in any one elementary school subject through the approximation of this Subject Ratio to 1.00. As we will see later, Subject Quotients approach the Intelligence Quotients when special treatment is given; that is, the correlation of SQ and IQ becomes nearer 1.00 and the difference between the average IQ and the average SQ approaches zero. It is safe then to expect these Subject Ratios to be at least 1.00 before we pronounce satisfaction with the school product.
There is certainly a significant relation between IQ and SQ, and the more perfect the educational procedure has been, the more it has called forth all that the child is capable of, the higher it will be. To determine whether the quotient in any school subject can be greater than the Intelligence Quotient in any significant amount, it will only be necessary after we have perfect age norms by months to get that quotient amongst enough pupils whom we know to be working at maximum. What is significant here is that the more nearly any such quotient reaches or exceeds the Intelligence Quotient the more nearly has the child been brought up to [6]what he is able to do under the best conditions. The Accomplishment Ratio is the degree to which his actual progress has attained to his potential progress by the best possible measures of both.
This would be a mark of the child’s effort, a mark of the concentration and interest that the child has in the school work, and as far as no inherited traits or capacities other than intelligence affect school work it is a measure of the efficiency of a child’s education thus far. If there are such other innate bases, it is also a measure of those inherited traits and capacities or their predisposition, such as concentration, effort, written expression, etc. At any rate it is a measure of the child’s accomplishment, and so of the effort and concentration as they really are at present working under those school conditions. It is an index of achievement irrespective of intelligence.
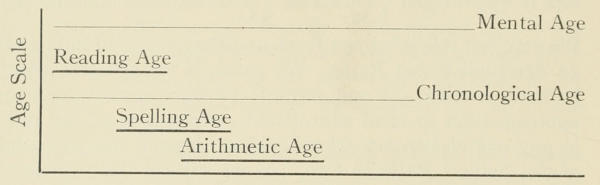
A very convenient graph representing the same facts and easily interpreted by the teacher may be constructed thus:
Here it can be easily shown that Spelling Age, Reading Age, Arithmetic Age, etc., are in some definite relation to both Chronological Age and Mental Age. Using the Mental Age line as a goal, these records may be kept constantly up to date. Another use of the Accomplishment Ratio is as the medium in which the children may keep records of their own work. As it is a mark in terms of intelligence, dull and brilliant children may compete on a parity to bring their Accomplishment Ratios as high as possible.
Mainly we have advanced formal education. We have in many ways promoted the abilities to read, write, spell and figure. But our philosophy of education has advanced far beyond that. We have other aims in education, and consequently other methods and modes, which also must be measured and judged. We wish to promote such qualities as stability, self-reliance, concentration, and ambition. It does not necessarily follow that we must measure these things directly, although every one vitally interested in [7]measurement cherishes the hope that we may some day measure their behavioristic correlates,—“For the quality of anything exists in some quantity, and that quantity can be measured.”
“Some of us might be entirely willing to rest the case after asking whether in practical school life anyone ever saw a teacher thoroughly confident of teaching ideals but neglectful of reading and arithmetic. The fact is that the conscientious teacher always gives attention to both and the successful teacher is able, without omitting one, to cultivate the other. The theoretical possibility of thinking of the two results separately has little significance in dealing with real teachers and real schools. Good reading is a school virtue; and when one has measured good reading he has measured more than the trivial or formal side of education.”[3]
This I believe to be true, but I also believe that through measurement we can actually promote those other more ethical ideals in education. Through classification by information and by intelligence we gain a marked increase of attention, concentration, ambition, and other objectives, measured in part by Accomplishment Ratios. More discussion due to a greater homogeneity promotes powers of inference and insight; being only with equals promotes self-confidence and honor, and in many cases prevents a regrettable conceit among supernormals; having work to do which is hard enough prevents habits of indolence and carelessness so commonly found among intelligent children.[4]
It is a well-known fact that much work must be done in classification to get homogeneity or real conditions of teaching. As it is, most teachers are talking to the middle of their classes. When they do they mystify the lower quarter and bore the upper quarter; they talk to the upper quarter and mystify the lower three quarters; [8]or they talk to the lower quarter and bore the upper three quarters. When a child is bored or mystified his Subject Quotients become less while his Intelligence Quotient remains constant. Then his Accomplishment Ratios become less as long as he remains in a position where he is being mistreated educationally. This, then, is the proper measure to see whether a child is classified properly or not. At the Garden City public school I changed as far as I was able the conditions of education of each child in that subject wherein his Accomplishment Ratio was markedly below 1.00. The concentration and effort of the child were obviously low and my attempt was to change conditions and to promote habits of consistent work. When the Accomplishment Ratio increased I knew that the child was profiting, that he was working. Our objective was to increase Ratios of all children, not to attain any set standard.
This Accomplishment Ratio would, to my mind, be an ideal school mark. Besides the inaccuracy of marks to-day, which are accurate marks only of the teacher’s opinion, biased as it is by the personal equation of her character with that of the pupil, there is another fault of prevalent school marking. It is based on average work. The mark is the link between education in the school and education in the home. It gives the parents an index of the child’s work and allows them to encourage or discourage the child’s attitudes. Such indices have no real significance when they are based upon average development, as the parent is generally mistaken about the ability of the child.
Marks given by a teacher are satisfactory only for a normal child with normal age for the grade. Brilliant children are over-praised for work which, though over the ability for the group, is under their own ability. Marks given to stupid children are misinterpreted by parents so as greatly to prejudice the effort of the child. Though his work may be such as to merit encouragement his mark may be very low. Teachers’ marks are, aside from their inaccuracy, just, only in a group that is perfectly classified; just, only when the children are all of the same ability and all possess the same initial information. So far as they are unjust they are subversive of our aims, as they then transmit a faulty [9]message to the home and disrupt the continuity of school and home education.[5]
Such marks as are here advocated would correct this feature of our present system, as well as the inaccuracy of our present marks. It is a mark which evaluates the accomplishment of the child in terms of his own ability. A brilliant child would no longer be praised for work which in terms of his own effort is 70 per cent perfect, in terms of the maximum of the group 90 per cent. The teacher gives him a mark of 90 while we mark him 70. A stupid child who does work which is marked 70 in terms of the maximum of the class but 90 in terms of his own, a limited ability, is no longer discouraged. His effort is evaluated, and the praise which he receives from home is merited and consequently economical, since the resultant satisfaction cements the bonds of concentration and attention. Such a mark is an actual index of the effort that child is making and consequently forms the proper link between the school and the home.
Parents would need no great instruction in the interpretation of these marks, since they have always acted as though the other marks were these, and since these also are in percentage form. The only kind of mark they can understand is an Accomplishment Ratio. I found that the parents of the children at Garden City were more attentive to such marks than to others, and acted upon them more readily. Of course the parents of the very intelligent children, who are used to marks above 90, are surprised at first when you tell them that your mark of the child is 80; but upon explanation, which should in all cases precede the first report to the parents, they immediately see the value of such grading. It is fortunate in this connection that the greatest amount of explanation is necessary about intelligent children, as one usually deals then with intelligent parents.
In this study age norms were derived empirically, both regression lines being taken into consideration. From the point of view of [10]statistics it becomes imperative, in order to use the technique here advised, to have the average age of a score—since we are going to predict age from score—to translate crude scores into indices of maturity in each subject under consideration. We are in error in the use of grade norms, if we find the average score of a grade and then, when we obtain that score in practice, say that the work is of that grade. To be able to say this we must know the average grade of a score. This takes in an entirely different cross-section of data. If we get the average score of all children in grade 6, then we can predict what a 6th grade child is likely to get, but we can say nothing about a child who is not in grade 6. In order to decide that a 4th grade child has 6th grade ability, we must know that he has such ability that all children who share this score make an average grade of 6.[6] It would be wise then to get the regression of score on age as well as the regression of age on score, since they are not identical, the correlation between score and age being less than unity.
We will note in passing that the data to establish these norms, except those of reading, are not as complete as may be desired, inasmuch as it was difficult to get test scores where the age in months also was available. However, the general data behind the grade norms could be used to keep the results from any crude error; and the averages were obtained for every month from 8 years to 14 years, with a corresponding refinement in intervals of score, which made still more improbable an error in the general tendency of the regression lines. Then all the distributions, when grouped by years, were corrected for truncation; that is, the tendency for the brighter children of the older group to be in high school (the data were from elementary schools only) and the duller children of the younger group to be in the lower grades where they could not be reached was recognized and corrected by finding the average, standard deviation, and number of cases which would have existed if these forces of truncation were not operating. This was done by the use of the other one half of the figures comprising Table XI of Pearson’s Tables for Statisticians and Biometricians. Dr. Truman L. Kelley pointed the way to its derivation.
These norms differ somewhat from those derived from the grade [11]norms by translation of grade into average age for the grade. This is because the norm for a grade is the average score for a grade. Hence the norm of age 10 obtained in this way is the average score obtained by a grade whose average age is 10. Then the data used to obtain this average are made up of diverse ages, all of one grade, instead of all of one age and diverse grades. Even then, we would have only an average score of an age which approximates what we want, but is not as reliable to use as average age for a score.
The following procedure was employed in the experiment. The experiment was carried out in the public school at Garden City. Two hundred children were given the tests. The instructions, shown below, were followed in November, 1919, and in November, 1918; in June, 1919, and in June, 1920, with the exception that no arithmetic test was used in November, 1918, and June, 1919. The Binet tests were given by the author; all of the others were given either by the author or the principal who was careful not to deviate from the directions in any way. In June of both years the author gave instructions for a test in one room, and then left the teacher in charge and went on to the next. This could be done in June of each year as the teachers were then fully acquainted with the experiment and their coöperation was assured.
Directions
I. Administer and score the following tests according to standard instructions. Give all tests to grades 3 and above.
- Woody-McCall Mixed Fundamentals in Arithmetic
- Thorndike Reading Scale Alpha 2
- Thorndike Visual Vocabulary Scale, A2
- Kelley-Trabue Completion Exercises in Language
- Stanford-Binet Tests (given by the author)
II. Translate the scores into year-month indices of maturity by means of the following table. (Use Mental Age for the Binet.) Assume rectilinear development, that is, that the amount of score which equals the development of one month is the same as the amount of score which equals the development of any other month. Then interpolation and extension are allowable. Use the table in this way: Find in the table the score made by a child (for instance in the Woody-McCall); find the age to which it corresponds, then call this age the Arithmetic Age of [12]the child. For instance, if the score in Woody-McCall is 20, his Arithmetic Age is about halfway between 10 and 11 or 10 years 6 months.
Age Woody-McCall Alpha 2 Visual Vocab. Kelley-Trabue 8—0 12.00 4.50 3.60 4.30 9—0 15.16⅔ 4.98 4.32 5.00 10—0 18.33⅓ 5.46 5.04 5.65 11—0 21.50 5.94 5.76 6.35 12—0 24.66⅔ 6.42 6.48 7.05 13—0 27.83⅓ 6.90 7.20 7.70 III. Arrange these Arithmetic Ages of all the children of your school in order from high to low with the names opposite the scores in the extreme left-hand column of the paper. At the right have parallel columns of the grades. Check the grade of each child in these columns. You will then have a sheet like this:
Name Arith. Age Grade 4 5 6 7 8 B A B A B A B A B A Gertrude Smith 180 # Saul Sampson 176 # Ed Jones 176 # George Calut 172 # Ida Henry 172 # Raymond Teller 172 # Ed Hoard 172 # Etc. Do the same with each of the tests. It is clear that, independent of the unreliability of the test, if your school were perfectly classified all the 8th grade children would come first on each relation sheet and then [13]the 7th grade children, etc. You have now a picture of the overlapping of your grades. Regrade in reading and arithmetic. Draw horizontal lines across these relation sheets at the points of delineation. Divide your total number of children by the number of teachers available and then make a class division by the number of pupils, that is, call the upper one-sixth of the total number of pupils grade 8 in this subject, the next one-sixth, grade 7, etc. Teach all grades of arithmetic at the same time and all grades of reading at the same time. You can now send each pupil to the grade in which he belongs in each subject.
IV. Call each derived age a Subject Age (SA). Divide each subject age by the chronological age of the child. This will yield what may be called a Subject Quotient (SQ), previously called an Educational Quotient (EQ).[7] Dividing the Reading Age by the Chronological Age, you arrive at a Reading Quotient. This RQ is the rate at which the child has progressed in reading. We have the same kind of quotient for intelligence (Stanford-Binet IQ). This IQ is the potential rate of progress of the child.
V. The ratio of any Subject Age to Mental Age[8] may be called a Subject Ratio (SR), previously called an Accomplishment Quotient (AccQ).[7] This Subject Ratio gives the proportion that the child has done in that subject of what he actually could have done, and is a mark of the efficiency of the education of the child in that subject to date. The goal is to bring up these Subject Ratios as high as possible. When they are above .90, the child may be considered as receiving satisfactory treatment, providing norms for subject ages are reasonably accurate. (This figure, .90, applies to a Subject Ratio obtained by using a Stanford-Binet Mental Age.) An Arithmetic Ratio based on one arithmetic test and one intelligence test only is not as good as one based on three arithmetic tests and three intelligence tests. If Subject Ratios go far over 1.00 the chances are that the Mental Age diagnosis is too low. The average of the Subject Ratios of a child may be called his Accomplishment Ratio.
In the application of the above instructions, whenever opportunity offers for classification of both subject matter and intelligence (which means many teachers or a large school), use a Relation Sheet (for instance for Arithmetic) and then have additional columns at the extreme right for intelligence headed A, B, C, and D. If a child’s IQ is in the upper quarter of the IQ’s of your school, check in the column A opposite his name; if it is in the upper [14]half but not in the upper quarter check in B, and so on with C and D. Then you will be able to split each group; for instance, the one which is defined as 8th grade in arithmetic ability, into four sections, each of which progresses at a rate differing from the others. The A section will progress most rapidly, B next, C more slowly, and D most slowly.
As Garden City was a small school, adjustment of procedure to individual differences in intelligence, besides the grouping for subject matter, was done mostly by pushing children. Children were advanced whole years (the grade they “belonged to” was the one in which geography and history were taught; this was their home grade) besides the readjustment made by the special regrading in reading and arithmetic. A special treatment class was formed where pronounced negative deviates were given special attention. Regrading was also instituted for spelling. Children were promoted whenever it was considered advisable; teachers were switched from subject to subject whenever that was considered advisable by the principal and the author. The Thorndike Arithmetics and other new texts were introduced to some extent. Any change possible was made in order to bring EQ/IQ as high as possible. That was the goal. The purpose was not to prove that any certain educational procedure would tend to promote abilities more rapidly than others, but that abilities could be promoted to the level of intelligence—that intelligence is substantially the exclusive inherited determinant of variety of product among school children. (It is to be understood that intelligence may be, and probably is, the summation of thousands of inherited factors,—neutral elements, here merged in the broader behavioristic concept of intelligence.)
If we were able to negate other influences upon disparity of product, we could conclude that these were not inherited. Hence it would be our burden as educators so to manipulate education as to prevent their operation. We will attempt to analyze the determinants of individual differences in product in these children, to see which influences besides intelligence are part of the inborn equipment which is not the province of education, but of eugenics, to correct. No absolute validity is held for any of the conclusions stated here. The subject is, at best, vague and complicated; but [15]our conclusions can be used as the basis for a good guess in school procedure. We can judge general tendencies from the educational experiences of the two hundred children whose abilities for two years are here charted.
The importance to educators of the subject in hand is excuse enough for its treatment. All educational procedure points a prophetic finger toward the classification of pupils and a reduction of the individual differences of product to the inherited bases of these differences.
Classification, however, needs some more accurate psychological foundation than the mere awareness of individual variance. We must know:
1. What tests to use.
2. How to use them.
3. Whether abilities in reading, spelling, and arithmetic or their predispositions exist as special abilities, or whether children differ in these simply because of their innate differences of intelligence.
4. Whether individual differences in ambition, interest, and industry, in so far as they influence accomplishment, are due to special tendencies, or whether they are learned manifestations of a more general heritage.
5. How these proclivities, specific or general, are related to intelligence.
Points 1 and 2 are problems of procedure which must be evolved from our existent knowledge of measurements and statistics. Points 3, 4, and 5 are problems which must be solved from the evidence resulting from an experiment in classification using these methods. Points 4 and 5 introduce the vexed question of whether there is a “general factor” or some general inherited cause of disparity in school product other than intelligence. Should reading ability prove to be the result of certain inherited abilities, or predisposition to abilities, we could not use a measure of mental ability alone as the guide to what a child could attain in reading. If intelligence, however, were the only inherited prognostic factor of school achievement, we could mark the education which had functioned in the child’s life by the percentage which the actual accomplishment of the child was of the maximum accomplishment of which he was capable at that stage of his mental development. So, too, if interest in particular subjects and ambition are not mainly the result of [16]rewards and punishments of early life, but are themselves significantly rooted in the nature of the child, we could not condemn or commend curricula and methods upon a basis of the ratio of resultant accomplishment to mental ability, but must include a measure of this potentiality. The practical queries whether or not a child can do reading as well as he does arithmetic, whether his ambition and his honesty have their origin in the same strength or weakness, can be answered only when these problems are fully solved. The immediate consequences of knowing that a child can usually be taught to read if he does other tasks well is of obvious import. It would be of great service, too, to know whether lack of application can be corrected so as to bring concentration to the level of the other traits. If a child is normal in other ways and not in his tendency to respond to the approval of others by satisfaction, can this “drive” be increased or reduced to the average, or are individual differences in specific original tendencies basic to development of character, and if they are, how much influence do these differences exert upon school accomplishment? In order to classify children and comprehendingly watch and control their progress we must know the relation of achievement to the inherited bases upon which it depends. We must be able to state a child’s progress in any one school subject in terms of the potential capacity of the child to progress. We must know the inherited determinants of disparity in school product.
[17]
In the discussion and tables which follow:
Q stands for Quotient, which will mean a Subject Age divided by a Chronological Age. R stands for Ratio, which will mean a Subject Age divided by a Mental Age.
AQ means Woody-McCall Arithmetic Age divided by Chronological Age, and AR means this AA divided by Mental Age.
VQ means Thorndike Vocabulary Age divided by Chronological Age, and VR means this VA divided by Mental Age.
RQ means Alpha 2 Reading Age divided by Chronological Age, and RR means this RA divided by Mental Age.
CQ means Kelley-Trabue Completion Age divided by Chronological Age, and CR means this CA divided by Mental Age.
SQ means any Subject Quotient, that is, any Subject Age divided by Chronological Age, and SR means any Subject Ratio, that is, any SA divided by Mental Age.
EQ means the average of all Subject Quotients and AccR, the Accomplishment Ratio, means the average of all Subject Ratios.
All r’s are product-moment correlation coefficients, uncorrected. As the reliabilities (Table 4) are almost what the other coefficients are in June, 1920 (Table 5), it is apparent that the corrected coefficients, when Grade III is excluded, would all be very near unity at that time.
In Table 1 are presented all the quotients for all periods of testing, grouped by children. The table, a sample of which is included here,[9] shows clearly how all SQ’s approach IQ as special treatment continues. The grades indicated in this grouping are as of June, 1920. Inasmuch as many double and triple promotions were made in an effort to get maximum product for intelligence invested, no conclusion can here be formed of the grade to which these children belonged at any time except June, 1920. The correspondence between IQ and the SQ’s in June, 1920 is further shown in Table 2. In this table the 48 children who took all tests at all periods are ranked from high to low IQ and their SQ’s are listed opposite. The high correspondence is readily apparent.
[18]
The children are arranged by grade as they were in June, 1920, and alphabetically within the grade. The periods of testing are lettered in their chronological sequence; a is November, 1918, b is June, 1919, c is November, 1919 and d is June, 1920. * = Zero Score
Grade 3
| Intelligence Quotient | Test Period | Arithmetic Quotient | Vocabulary Quotient | Reading Quotient | Completion Quotient |
|---|---|---|---|---|---|
| 101 | a | ||||
| b | |||||
| c | 64 | 58 | 43 | ||
| d | 106 | 88 | 93 | ||
| 128 | a | ||||
| b | |||||
| c | 80 | 102 | 81 | ||
| d | 152 | 124 | 153 | ||
| 116 | a | ||||
| b | |||||
| c | 56 | 90 | * | 49 | |
| d | 94 | 95 | 77 | 89 | |
| 87 | a | ||||
| b | |||||
| c | 90 | 40 | 35 | 54 | |
| d | 72 | 74 | 61 | 52 | |
| 112 | a | ||||
| b | |||||
| c | 90 | 137 | 133 | 112 | |
| d | 112 | 113 | 121 | 131 |
[19]
| Intelligence Quotients | Arithmetic Quotients | Vocabulary Quotients | Reading Quotients | Completion Quotients |
|---|---|---|---|---|
| 146 | 111 | 154 | 164 | 150 |
| 142 | 129 | 135 | 137 | 136 |
| 141 | 109 | 118 | 107 | 121 |
| 139 | 124 | 141 | 124 | 134 |
| 138 | 101 | 112 | 105 | 106 |
| 138 | 121 | 130 | 110 | 109 |
| 130 | 107 | 139 | 135 | 136 |
| 122 | 127 | 130 | 124 | 121 |
| 122 | 113 | 121 | 117 | 124 |
| 122 | 112 | 102 | 114 | 129 |
| 121 | 128 | 125 | 128 | 128 |
| 120 | 100 | 116 | 102 | 119 |
| 118 | 117 | 123 | 114 | 125 |
| 117 | 131 | 111 | 118 | 124 |
| 117 | 106 | 122 | 112 | 111 |
| 114 | 105 | 126 | 110 | 114 |
| 109 | 83 | 113 | 117 | 103 |
| 107 | 103 | 112 | 95 | 103 |
| 107 | 94 | 126 | 94 | 123 |
| 104 | 99 | 117 | 96 | 104 |
| 104 | 103 | 110 | 94 | 116 |
| 103 | 108 | 113 | 112 | 106 |
| 101 | 100 | 114 | 109 | 106 |
| 100 | 90 | 103 | 92 | 92 |
| 100 | 109 | 118 | 108 | 113 |
| 99 | 114 | 104 | 106 | 110 |
| 99 | 114 | 119 | 117 | 115 |
| 98 | 102 | 101 | 108 | 104 |
| 98 | 99 | 106 | 107 | 106 |
| 97 | 95 | 109 | 107 | 105 |
| 97 | 108 | 101 | 102 | 105[20] |
| 97 | 95 | 104 | 89 | 110 |
| 96 | 90 | 104 | 91 | 91 |
| 95 | 84 | 99 | 93 | 100 |
| 95 | 90 | 107 | 99 | 105 |
| 95 | 85 | 117 | 114 | 103 |
| 94 | 106 | 57 | 89 | 108 |
| 94 | 103 | 103 | 106 | 104 |
| 92 | 96 | 86 | 94 | 85 |
| 87 | 83 | 88 | 92 | 87 |
| 87 | 95 | 96 | 94 | 102 |
| 84 | 85 | 87 | 93 | 87 |
| 83 | 106 | 91 | 87 | 104 |
| 80 | 77 | 91 | 80 | 84 |
| 80 | 84 | 75 | 79 | 84 |
| 80 | 89 | 107 | 88 | 86 |
| 78 | 87 | 90 | 93 | 85 |
| 60 | 69 | 56 | 71 | 77 |
The intercorrelations of the quotients of these 48 cases for all periods may be seen in Table 3 (page 21). The correlations with IQ and the intercorrelations of the SQ’s have increased toward positive unity or rather toward the limits of a correlation with tools of measurement such as we have used. This limit is a function of the reliability of the tests employed. It is customary to use a formula to correct for attenuation in order to find the percentage which the correlation is of the geometric mean of the two reliability coefficients. This is tantamount to saying that any correlation can go no higher than the geometric mean of the reliability coefficients of the tests used. It is better to assume that an r [21]can go as high as the ∜(r₁₁⋅r₂₂) since an r can go as high as the square root of its reliability coefficient. Dr. Truman L. Kelley has shown that the correlation of a test with an infinite number of forms of the same test would be as the square root of its correlation with any one other form.
The reliabilities and limits defining a limit as the fourth root of the multiplied reliability coefficients are in Table 4.
Correction for attenuation is often ridiculously high because the reliability coefficient of one of the measures used is so low. If an element is included in the two tests which are correlated, but not in the other forms of each test used to get reliability, the “corrected coefficient” is corrected for an element which is not chance. Whenever the geometric mean of the reliabilities is less than the obtained r, the corrected r is over 1.00 and hence absurd.[12]
Therefore we use here instead, a comparison to the maximum possibility in a true sense. Since a test correlates with the “true ability” √(r₁₁), ∜(r₁₁⋅r₂₂) is the limit of an r, its optimum with those tools. Although these limits apply, strictly speaking, only to the total correlations, since the reliability correlations are with all the data; we may assume that the same facts hold with regard to the correlations of each of the grades, that is, the reliability is a function of the test not of the data selected.
| November, 1918 | ||||||
|---|---|---|---|---|---|---|
| IQ | VQ | RQ | S.D. | M | ||
| IQ | 19.12 | 105.15 | ||||
| ±1.32 | ±1.86 | |||||
| VQ | .72 | 20.54 | 102.52 | |||
| ±.05 | ±1.41 | ±2.00 | ||||
| RQ | .64 | .64 | 19.09 | 95.90 | ||
| ±.06 | ±.06 | ±1.31 | ±1.86 | |||
| CQ | .63 | .71 | .77 | 19.34 | 99.44 | |
| ±.06 | ±.05 | ±.04 | ±1.33 | ±1.88[22] | ||
| June, 1919 | ||||||
| IQ | VQ | RQ | S.D. | M | ||
| IQ | 19.12 | 105.15 | ||||
| ±1.32 | ±1.86 | |||||
| VQ | .73 | 20.80 | 113.54 | |||
| ±.05 | ±1.43 | ±2.02 | ||||
| RQ | .65 | .58 | 14.73 | 101.31 | ||
| ±.06 | ±.06 | ±1.01 | ±1.43 | |||
| CQ | .62 | .68 | .77 | 19.76 | 101.04 | |
| ±.06 | ±.05 | +.04 | ±1.36 | ±1.92 | ||
| November, 1919 | ||||||
| IQ | AQ | VQ | RQ | S.D. | M | |
| IQ | 19.12 | 105.15 | ||||
| ±1.32 | ±1.86 | |||||
| AQ | .46 | 14.08 | 102.90 | |||
| ±.08 | ±0.97 | ±1.37 | ||||
| VQ | .86 | .23 | 17.07 | 109.17 | ||
| ±.03 | ±.09 | ±1.18 | ±1.66 | |||
| RQ | .65 | .56 | .71 | 13.91 | 101.42 | |
| ±.06 | ±.07 | ±.05 | ±0.96 | ±1.35 | ||
| CQ | .79 | .47 | .83 | .82 | 17.53 | 105.21 |
| ±.04 | ±.08 | ±.03 | ±.03 | ±1.21 | ±1.71 | |
| June, 1920 | ||||||
| IQ | AQ | VQ | RQ | S.D. | M | |
| IQ | 19.12 | 105.15 | ||||
| ±1.32 | ±1.86 | |||||
| AQ | .73 | 14.10 | 101.79 | |||
| ±.05 | ±0.97 | ±1.37 | ||||
| VQ | .81 | .60 | 18.89 | 108.94 | ||
| ±.03 | ±.06 | ±1.30 | ±1.84 | |||
| RQ | .79 | .68 | .87 | 16.43 | 104.94 | |
| ±.04 | ±.05 | ±.02 | ±1.13 | ±1.60 | ||
| CQ | .84 | .77 | .78 | .84 | 15.87 | 108.08 |
| ±.03 | ±.04 | ±.04 | ±.03 | ±1.09 | ±1.54 | |
[23]
| One Form of Each Test | Two Forms of Each Test (by Brown’s Formula) | One Form with an Infinite Number of Forms | Two Forms with an Infinite Number of Forms | |
|---|---|---|---|---|
| r₁₁ | r₁₁ | √r₁₁ | √r₁₁ | |
| Intelligence Quotient | .888 | .942 | ||
| (by Brown’s Formula)[13] | ||||
| Arithmetic Quotient | .824 | .904 | .908 | .951 |
| Vocabulary Quotient | .820 | .901 | .906 | .949 |
| Reading Quotient | .866 | .928 | .931 | .963 |
| Completion Quotient | .883 | .938 | .940 | .968 |
Limits of the r’s = ∜(r₁₁ × r₂₂)
| Nov. 1918, June and Nov. 1919 |
June 1920 | |
|---|---|---|
| IQ and AQ | .925 | .946 |
| IQ and VQ | .924 | .946 |
| IQ and RQ | .936 | .953 |
| IQ and CQ | .941 | .955 |
The limits of the June, 1920 r’s are naturally somewhat larger than the others since two forms of tests (except the Binet) were used; the unreliability of the quantitative indices is therefore lower and hence the correlation with IQ may be larger.
The correlations in 1920 of another group—the whole school except Grade III—are reproduced in Table 5. Grade III was excluded since here there had as yet been little chance to push the r’s. Partials were obtained with these data (Table 6). Little faith may be placed in the relative sizes of these partials, much because the rVQ.RQ is here only .73 and, in the data presented in Table 3, it is .87. This is due to the fact that the data in Table 3 cover all periods (2 years) while those in Table 5 cover only one. This difference has comparatively slight influence on our general conclusions; but it makes a huge difference in the correlation of RQ and VQ when IQ is rendered constant, whether the one or the other set of data is used. Moreover, the whole logic of arguing for general factors by reduction of partial correlations from the original r has been called gravely into question in Godfrey H. Thomson’s recent work on this subject: “The Proof or Disproof of the Existence of General Ability.” Thomson shows that partial correlation gives one possible interpretation of the facts, but not an inevitable one. Thus we cannot say that because RQ and IQ and RQ and AQ are highly correlated, correlation of IQ and AQ is dependent upon RQ. We can say, however, that it is likely to be. IQ and AQ may be correlated by reason of inclusion of some element not included at all in RQ. The higher the correlations which we deal with the less we need worry about this, and of course correlations of unity exclude any such consideration.
[24]
The P.E.’s are all less than .05
N = 81
| IQ | Arithmetic Quotient |
Vocabulary Quotient |
Reading Quotient |
|
|---|---|---|---|---|
| Arithmetic Quotient | .733 | |||
| Vocabulary Quotient | .837 | .628 | ||
| Reading Quotient | .758 | .694 | .734 | |
| Completion Quotient | .821 | .770 | .825 | .801 |
I therefore draw no conclusions from the comparative size of these partials, nor do I get partials with any of the other data, and rest the case mainly on the high r’s between IQ and SQ’s in 1920; increase in correspondence of the central tendencies and range of the SQ’s by grade with the central tendency and range [25]of the IQ’s of the same data; small intercorrelation of SR’s and negative correlation of AccR with IQ.
The general lowness of the partials (Table 6) does, however, indicate the great causative relation between IQ and disparity of product. The elements still in here are common elements in the tests and the mistreatment of intelligence.
N = 81
| Arithmetic Quotient |
Vocabulary Quotient |
Reading Quotient |
|
|---|---|---|---|
| Vocabulary Quotient | .04 | ||
| ±.07 | |||
| Reading Quotient | .31 | .28 | |
| ±.07 | ±.07 | ||
| Completion Quotient | .43 | .44 | .47 |
| ±.08 | ±.06 | ±.06 |
What happened by grade in 1918-1919 is summarized in Table 7. What happened by grade in 1919-1920 is summarized in Table 8. Since there were many changes in personnel from 1918-1919 to 1919-1920, we need expect no continuity from Table 7 to Table 8. For the continuous influence of the two years, see Table 3, which includes 48 children taking all tests at all periods.
| GRADE | r | M | S.D. | ||||||
|---|---|---|---|---|---|---|---|---|---|
| Nov. | June | Nov. | June | Nov. | June | ||||
| III | I V | .467 | .633 | I | 109.89 | 113.20 | I | 12.83 | 15.49 |
| ±.12 | ±.07 | ±1.98 | ±1.91 | ±1.40 | ±1.35 | ||||
| I R | .541 | .492 | V | 96.11 | 109.90 | V | 21.21 | 18.69 | |
| ±.11 | ±.09 | ±3.28 | ±2.30 | ±2.32 | ±1.63 | ||||
| I C | .641 | .386 | R | 82.26 | 101.40 | R | 22.58 | 15.85 | |
| ±.09 | ±.11 | ±3.49 | ±1.95 | ±2.47 | ±1.38 | ||||
| C | 86.89 | 108.40 | C | 22.76 | 15.79 | ||||
| ±3.52 | ±1.94 | ±2.49 | ±1.37 | ||||||
| N = | 19 | 30 | [26] | ||||||
| IV | I V | .724 | .819 | I | 105.90 | 104.82 | I | 18.08 | 18.21 |
| ±.07 | ±.05 | ±2.73 | ±2.98 | ±1.93 | ±2.11 | ||||
| I R | .665 | .845 | V | 97.20 | 108.53 | V | 17.26 | 24.92 | |
| ±.08 | ±.05 | ±2.60 | ±4.08 | ±1.84 | ±2.88 | ||||
| I C | .596 | .717 | R | 91.06 | 107.82 | R | 27.85 | 10.35 | |
| ±.10 | ±.08 | ±4.20 | ±1.69 | ±2.97 | ±1.20 | ||||
| C | 101.45 | 108.12 | C | 21.53 | 17.75 | ||||
| ±3.25 | ±2.90 | ±2.30 | ±2.05 | ||||||
| N = | 20 | 17 | |||||||
| V | I V | .887 | .822 | I | 101.64 | 99.42 | I | 24.76 | 17.63 |
| ±.04 | ±.05 | ±3.56 | ±2.73 | ±2.52 | ±1.93 | ||||
| I R | .799 | .832 | V | 100.59 | 111.58 | V | 26.71 | 19.78 | |
| ±.05 | ±.05 | ±3.84 | ±3.06 | ±2.72 | ±2.16 | ||||
| I C | .818 | .890 | R | 94.59 | 101.42 | R | 22.10 | 12.56 | |
| ±.05 | ±.03 | ±3.18 | ±1.94 | ±2.25 | ±1.37 | ||||
| C | 97.00 | 102.68 | C | 22.52 | 17.71 | ||||
| ±3.24 | ±2.74 | ±2.29 | ±1.94 | ||||||
| N = | 22 | 19 | |||||||
| VI | I V | .793 | .772 | I | 109.90 | 115.90 | I | 23.45 | 24.38 |
| ±.08 | ±.09 | ±5.00 | ±5.20 | ±3.54 | ±3.68 | ||||
| I R | .497 | .726 | V | 108.00 | 126.80 | V | 30.20 | 25.25 | |
| ±.16 | ±.10 | ±6.44 | ±5.39 | ±4.55 | ±3.81 | ||||
| I C | .798 | .891 | R | 103.10 | 107.20 | R | 13.77 | 20.62 | |
| ±.08 | ±.04 | ±2.94 | ±4.40 | ±2.08 | ±3.11 | ||||
| C | 108.90 | 117.10 | C | 15.23 | 18.81 | ||||
| ±3.25 | ±4.01 | ±2.30 | ±2.84 | ||||||
| N = | 10 | 10 | |||||||
| VII and VIII | I V | .625 | .504 | I | 99.29 | 98.92 | I | 11.11 | 11.45 |
| ±.11 | ±.14 | ±2.00 | ±2.14 | ±1.42 | ±1.51 | ||||
| I R | .622 | .709 | V | 109.43 | 115.23 | V | 14.07 | 17.43 | |
| ±.11 | ±.09 | ±2.54 | ±2.95 | ±1.79 | ±2.31[27] | ||||
| I C | .782 | .730 | R | 97.00 | 98.85 | R | 12.59 | 15.77 | |
| ±.07 | ±.09 | ±2.27 | ±3.26 | ±1.61 | ±2.09 | ||||
| C | 102.43 | 95.85 | C | 13.49 | 17.72 | ||||
| ±2.43 | ±3.31 | ±1.72 | ±2.34 | ||||||
| N = | 14 | 13 | |||||||
| Total | I V | .685 | .680 | I | 105.07 | 106.88 | I | 19.34 | 18.45 |
| ±.04 | ±.04 | ±1.41 | ±1.32 | ±1.00 | ±0.93 | ||||
| I R | .568 | .626 | V | 101.12 | 112.67 | V | 22.83 | 21.58 | |
| ±.05 | ±.04 | ±1.67 | ±1.54 | ±1.18 | ±1.09 | ||||
| I C | .639 | .702 | R | 92.40 | 102.91 | R | 22.65 | 15.27 | |
| ±.04 | ±.04 | ±1.66 | ±1.09 | ±1.17 | ±0.77 | ||||
| C | 98.08 | 106.27 | C | 21.48 | 18.19 | ||||
| ±1.57 | ±1.30 | ±1.11 | ±0.92 | ||||||
| N = | 85 | 89 | |||||||
| r | M | S.D. | |||||||
|---|---|---|---|---|---|---|---|---|---|
| Nov. | June | Nov. | June | Nov. | June | ||||
| III | I A | .413 | .709 | I | 102.00 | 105.53 | I | 9.60 | 10.89 |
| ±.16 | ±.08 | ±1.87 | ±1.68 | ±1.32 | ±1.19 | ||||
| I V | .649 | .667 | A | 82.75 | 97.84 | A | 15.88 | 18.62 | |
| ±.11 | ±.09 | ±3.09 | ±2.88 | ±2.19 | ±2.04 | ||||
| I R | .651 | .609 | V | 94.00 | 103.47 | V | 33.44 | 27.66 | |
| ±.11 | ±.10 | ±6.51 | ±4.28 | ±4.60 | ±3.03[28] | ||||
| I C | .612 | .719 | R | 87.59 | 93.88 | R | 32.06 | 19.02 | |
| ±.12 | ±.07 | ±6.24 | ±3.21 | ±4.41 | ±2.27 | ||||
| C | 90.17 | 96.84 | C | 28.82 | 25.59 | ||||
| ±5.58 | ±3.96 | ±3.95 | ±2.80 | ||||||
| N = | 12 | 19 | |||||||
| IV | I A | .426 | .725 | I | 111.48 | 113.00 | I | 14.73 | 15.04 |
| ±.10 | ±.06 | ±1.85 | ±1.93 | ±1.30 | ±1.36 | ||||
| I V | .635 | .772 | A | 94.07 | 111.08 | A | 12.34 | 15.02 | |
| ±.075 | ±.05 | ±1.55 | ±1.99 | ±1.09 | ±1.40 | ||||
| I R | .316 | .569 | V | 109.79 | 115.61 | V | 16.97 | 18.39 | |
| ±.11 | ±.09 | ±2.13 | ±2.34 | ±1.50 | ±1.66 | ||||
| I C | .594 | .837 | R | 99.31 | 110.11 | R | 17.89 | 14.67 | |
| ±.08 | ±.04 | ±3.24 | ±1.67 | ±1.58 | ±1.32 | ||||
| C | 108.14 | 118.14 | C | 15.51 | 12.70 | ||||
| ±1.94 | ±1.62 | ±1.37 | ±1.15 | ||||||
| N = | 29 | 28 | |||||||
| V | I A | .698 | .713 | I | 103.72 | 98.83 | I | 19.57 | 18.84 |
| ±.07 | ±.07 | ±2.69 | ±2.65 | ±1.91 | ±1.87 | ||||
| I V | .881 | .908 | A | 87.58 | 99.71 | A | 12.43 | 16.47 | |
| ±.03 | ±.02 | ±1.71 | ±2.27 | ±1.21 | ±1.60 | ||||
| I R | .773 | .891 | V | 109.00 | 105.17 | V | 15.58 | 19.97 | |
| ±.06 | ±.03 | ±2.14 | ±2.81 | ±1.52 | ±1.99 | ||||
| I C | .786 | .923 | R | 104.46 | 103.00 | R | 16.99 | 17.07 | |
| ±.05 | ±.02 | ±2.34 | ±2.40 | ±1.65 | ±1.70 | ||||
| C | 107.00 | 103.48 | C | 16.12 | 14.51 | ||||
| ±2.22 | ±2.04 | ±1.57 | ±1.44 | ||||||
| N = | 24 | 23 | |||||||
| VI | I A | .533 | .805 | I | 102.43 | 105.39 | I | 11.61 | 13.56 |
| ±.13 | ±.06 | ±2.09 | ±2.16 | ±1.48 | ±1.52 | ||||
| I V | .774 | .858 | A | 91.43 | 104.53 | A | 11.43 | 11.31 | |
| ±.07 | ±.04 | ±2.06 | ±1.75 | ±1.46 | ±1.24[29] | ||||
| I R | .420 | .661 | V | 106.07 | 112.94 | V | 11.93 | 10.94 | |
| ±.15 | ±.09 | ±2.15 | ±1.74 | ±1.52 | ±1.23 | ||||
| I C | .739 | .620 | R | 96.64 | 106.20 | R | 12.38 | 11.88 | |
| ±.08 | ±.10 | ±2.23 | ±1.79 | ±1.58 | ±1.27 | ||||
| C | 100.36 | 107.61 | C | 13.95 | 10.55 | ||||
| ±2.51 | ±1.68 | ±1.78 | ±1.19 | ||||||
| N = | 14 | 18 | |||||||
| VII | I A | .740 | .795 | I | 107.27 | 100.58 | I | 23.29 | 19.78 |
| ±.09 | ±.07 | ±4.74 | ±2.85 | ±3.35 | ±2.72 | ||||
| I V | .867 | .718 | A | 100.00 | 99.31 | A | 9.26 | 11.00 | |
| ±.05 | ±.09 | ±1.86 | ±2.06 | ±1.33 | ±1.45 | ||||
| I R | .862 | .799 | V | 114.36 | 108.75 | V | 19.15 | 14.42 | |
| ±.05 | ±.07 | ±3.89 | ±2.81 | ±2.75 | ±1.98 | ||||
| I C | .833 | .677 | R | 101.73 | 98.58 | R | 12.28 | 11.56 | |
| ±.06 | ±.11 | ±2.50 | ±2.25 | ±1.77 | ±1.59 | ||||
| C | 105.82 | 101.42 | C | 17.41 | 16.02 | ||||
| ±3.54 | ±3.12 | ±2.50 | ±2.21 | ||||||
| N = | 11 | 12 | |||||||
| VIII | I A | .663 | .796 | I | 104.83 | 108.79 | I | 15.46 | 18.25 |
| ±.11 | ±.07 | ±3.01 | ±3.29 | ±2.13 | ±2.33 | ||||
| I V | .828 | .750 | A | 92.92 | 93.86 | A | 10.20 | 9.74 | |
| ±.06 | ±.08 | ±1.99 | ±1.76 | ±1.40 | ±1.24 | ||||
| I R | .775 | .722 | V | 111.67 | 117.21 | V | 16.44 | 14.02 | |
| ±.08 | ±.08 | ±3.20 | ±2.53 | ±2.26 | ±1.79 | ||||
| I C | .838 | .868 | R | 100.83 | 104.38 | R | 11.52 | 20.62 | |
| ±.06 | ±.04 | ±2.24 | ±3.72 | ±1.59 | ±2.63 | ||||
| C | 104.92 | 109.64 | C | 18.11 | 17.41 | ||||
| ±3.53 | ±3.14 | ±2.49 | ±2.22 | ||||||
| N = | 12 | 14 | [30] | ||||||
| Total | I A | .576 | .686 | I | 106.02 | 105.87 | I | 16.73 | 16.87 |
| ±.05 | ±.03 | ±1.12 | ±1.07 | ±0.79 | ±0.75 | ||||
| I V | .679 | .727 | A | 91.35 | 102.01 | A | 13.22 | 15.61 | |
| ±.04 | ±.03 | ±0.88 | ±0.98 | ±0.62 | ±0.69 | ||||
| I R | .529 | .609 | V | 107.95 | 110.54 | V | 19.76 | 19.57 | |
| ±.05 | ±.04 | ±1.32 | ±1.24 | ±0.93 | ±0.87 | ||||
| I C | .678 | .731 | R | 99.22 | 103.65 | R | 18.85 | 17.12 | |
| ±.04 | ±.03 | ±1.26 | ±1.08 | ±0.89 | ±0.76 | ||||
| C | 104.06 | 108.00 | C | 18.87 | 18.11 | ||||
| ±1.26 | ±1.14 | ±0.89 | ±0.81 | ||||||
| N = | 102 | 114 | |||||||
Note—Totals without Grade III are much higher than these (Table 5). Grade III has many children in it who have not been long enough in an academic situation to allow their SQ’s to go as high as they may.
It is proper to note here that not much can be expected from Grades III and VIII and from totals including Grade III, since children in Grade III have not been there long enough to be pushed, and children in Grade VIII have been pushed beyond the limits which the tests used will register. Our logic is one of pushed correlations. If the association of IQ and the SQ’s is what we are attempting to establish, it is necessary to show:
1. That the r comes near unity;
2. That the central tendencies come near coincidence;
3. That the S.D.’s come near coincidence.
The value of the r is obvious; the value of coincidence of means becomes clearer if we think of Σ(IQ-EQ)/n, the average difference of potential rate of progress and actual rate of progress. This average of differences is the same as the difference of the averages, which is more readily calculated. Obviously, if we wish to use an AccR, it is necessary to show more than correspondence when [31]differences in average and spread are equated as they are by the correlation coefficient. Besides, coincidence of M’s, correspondence of S.D.’s is also necessary since a correlation might be positive unity, the M’s might be equal, and still the spread of one measure might be more than the spread of the other. If the spreads are the same and the M’s are the same, and the correlation is positive unity, each x must equal its corresponding y. Then b₁₂ = b₂₁ = 1.00; and the M’s being equal, the deviations are from the same point. Therefore, we will attempt to measure similarity of M’s and S.D.’s as well as r.
It will be observed that both Tables 7 and 8 give evidence of each of these tendencies in all grades. In Table 8 marked progress in arithmetic is apparent. This is due to re-classification in terms of the Woody-McCall test, which was not done in 1918-1919. In 1918-1919 no arithmetic test was given and all re-classification was in terms of reading, being done on the basis of both reading tests. Spelling re-classification was done each year, but the data were not treated in this manner. It can be said that wherever re-classification in terms of intelligence and pedagogical need was undertaken the desired result of pushing the SQ’s up to IQ was hastened. Of all the remedial procedure, such as changing teachers and time allotment and books and method, all of which were employed to some extent, it is my opinion that the re-classification was more important than everything else combined.
It is noticeable that when r’s approach the limit which the unreliability of the test allows them, they drop down again. This is probably due to continued increase of SQ’s over IQ. Of course, for some SQ’s to be greater than IQ out of proportion to the general amount lowers the correlation as much as for some to lag behind. When the SQ’s of the children of lower intelligence reach their IQ they continue above. This, of course, is due to errors in establishment of the age norms. The norms are not limits of pushing, though an attempt was made by correction for truncation to get them as nearly so as possible. It is to be noted, however, that these norms are up the growth curve, that is, reading age of 10 means a score such that the average age of those getting it is 10, not the average score of children whose mental age is 10. The average reading achievement of children all ten years old chronologically is higher than that of a group all mentally ten, since many of the mentally advanced have not been pushed in [32]product. The group used here to establish norms gives more nearly pushed norms than the others would.
The tendency of the low IQ’s to go over unity in their SR’s is apparent in Table 1 and in Table 12 and also in the negative correlation between AccR and IQ.
In both years some second grade children were advanced to Grade III during the year. This accounts for the low r’s in June, 1919, but in 1919-1920 the Grade III correlations are raised and the means raised toward the MIQ, even though some second grade children were put in this group during the year.
| GRADE | r | Average Intelligence Quotient Minus Average Arithmetic Quotient |
Difference of Standard Deviations Irrespective of Sign (of IQ and Arith. Q) |
|||
|---|---|---|---|---|---|---|
| Nov. | June | Nov. | June | Nov. | June | |
| III | .413 | .709 | 19.25 | 8.16 | 6.27 | 6.63 |
| ±.16 | ±.08 | ±2.87 | ±2.05 | ±2.04 | ±1.45 | |
| IV | .426 | .725 | 7.41 | 0.46 | 2.39 | 0.47 |
| ±.10 | ±.06 | ±1.84 | ±1.50 | ±1.29 | ±1.02 | |
| V | .698 | .713 | 16.14 | 0.54 | 7.14 | 2.06 |
| ±.07 | ±.07 | ±1.93 | ±1.84 | ±1.37 | ±1.30 | |
| VI | 5.33 | .805 | 11.00 | 3.00 | 0.19 | 1.63 |
| ±.13 | ±.06 | ±2.01 | ±1.19 | ±1.42 | ±0.85 | |
| VII | .740 | .795 | 7.27 | 0.62 | 14.03 | 8.15 |
| ±.09 | ±.07 | ±3.58 | ±2.33 | ±2.53 | ±1.63 | |
| VIII | .663 | .796 | 11.92 | [14]14.93 | 5.26 | [14]8.53 |
| ±.11 | ±.07 | ±2.25 | ±2.69 | ±1.59 | ±1.54 | |
| Total | .576 | .686 | 14.67 | 3.72 | 3.51 | 1.16 |
| ±.05 | ±.03 | ±0.94 | ±0.81 | ±0.67 | ±0.57 | |
[33]
| GRADE | r | Average Intelligence Quotient Minus Average Reading Quotient |
Difference of Standard Deviations Irrespective of Sign (of IQ and RQ) |
|||
|---|---|---|---|---|---|---|
| Nov. | June | Nov. | June | Nov. | June | |
| III | .541 | .492 | 27.63 | 11.80 | 9.75 | 0.36 |
| ±.11 | ±.09 | |||||
| IV | .665 | .845 | 14.84 | -3.00 | 9.77 | 7.86 |
| ±.08 | ±.05 | |||||
| V | .799 | .832 | 7.05 | -2.00 | 2.66 | 5.07 |
| ±.05 | ±.05 | |||||
| VI | .497 | .726 | 6.80 | 8.70 | 9.68 | 3.76 |
| ±.16 | ±.10 | |||||
| VII | .622 | .709 | 2.28 | 0.07 | 1.48 | 5.98 |
| 3 of VIII | ±.11 | ±.09 | ||||
| Total | .568 | .626 | 12.67 | 3.97 | 3.31 | 3.18 |
| ±.05 | ±.04 | |||||
| GRADE | r | Average Intelligence Quotient Minus Average Reading Quotient |
Difference of Standard Deviations Irrespective of Sign (of IQ and RQ) |
|||
|---|---|---|---|---|---|---|
| Nov. | June | Nov. | June | Nov. | June | |
| III | .651 | .609 | 14.41 | 11.57 | 22.46 | 8.62 |
| ±.11 | ±.10 | ±5.22 | ±2.55 | ±3.69 | ±1.81 | |
| IV | .316 | .569 | 12.17 | 2.43 | 3.16 | 0.76 |
| ±.11 | ±.09 | ±2.41 | ±1.78 | ±1.70 | ±1.26 | |
| V | .773 | .891 | -0.74 | -4.17 | 2.58 | 1.77 |
| ±.06 | ±.03 | ±1.72 | ±1.20 | ±1.22 | ±0.85 | |
| VI | .420 | .661 | 5.79 | 0.90 | 0.77 | 0.87 |
| ±.15 | ±.09 | ±2.33 | ±1.53 | ±1.65 | ±1.09 | |
| VII | .862 | .799 | 5.54 | 0.92 | 11.00 | 8.31 |
| ±.05 | ±.07 | ±2.88 | ±2.54 | ±2.03 | ±1.80 | |
| VIII | .775 | .722 | 4.00 | 4.43 | 3.94 | 2.41 |
| ±.08 | ±.09 | ±1.90 | ±2.64 | ±1.92 | ±1.87 | |
| Total | .529 | .609 | 6.80 | 2.86 | 2.12 | 0.06 |
| ±.05 | ±.04 | ±1.16 | ±0.30 | ±0.82 | ±0.67 | |
[34]
The changes in rates of progress are expressed in summaries by subject matter in Tables 9, 10, and 11. Approach of Arithmetic Quotient to Intelligence Quotient is measured in Table 9 by:
1. Comparison of r in June with r in November.
2. Comparison of MIQ-MAQ in June and MIQ-MAQ in November.
3. Comparison of S.D.’s of Arithmetic and Intelligence Quotients in June and November.
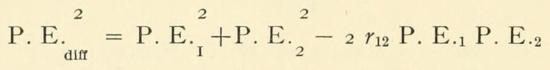
The P.E.’s of each of these differences were obtained by
P.E.diff² = P.E.₁² + P.E.₂² - 2 r₁₂ P.E.₁ P.E.₂
The only MIQ-MSQ in Table 9 which does not show a decrease at least two times as large as the P.E. of either of the elements involved, is the 8th grade; and this is due to the limits of the test used. As mentioned before, the 8th grade did not register its true abilities in June since a perfect, or nearly perfect, score in the test was too easy to obtain. The small arithmetic S.D.’s in Grade 8 and consequent great S.D.IQ-S.D.SQ is due to the same cause.
Tables 10 and 11 present the summary of facts with regard to Thorndike Reading Quotients, the first and second years respectively.
The discussion which follows concerns Ratios, not Quotients.
[35]
Grade III
| Intelligence Quotient | Arithmetic Ratio | Vocabulary Ratio | Reading Ratio | Completion Ratio | |
|---|---|---|---|---|---|
| 101 | a | ||||
| b | |||||
| c | 63 | 57 | 43 | ||
| d | 105 | 87 | 92 | ||
| 128 | a | ||||
| b | |||||
| c | 62 | 80 | 63 | ||
| d | 119 | 97 | 120 | ||
| 116 | a | ||||
| b | |||||
| c | 48 | 78 | * | 42 | |
| d | 81 | 82 | 66 | 77 | |
| 87 | a | ||||
| b | |||||
| c | 103 | 46 | 40 | 62 | |
| d | 83 | 85 | 70 | 60 | |
| 112 | a | ||||
| b | |||||
| c | 80 | 122 | 119 | 100 | |
| d | 100 | 101 | 108 | 117 | |
| 101 | a | ||||
| b | |||||
| c | 84 | 93 | 37 | 55 | |
| d | 90 | 110 | 98 | 92 | |
| 90 | a | ||||
| b | |||||
| c | 76 | 58 | 72 | 89 | |
| d | 68 | 121 | 77 | 102 | |
| 105 | a | ||||
| b | |||||
| c | 60 | 43 | * | 57 | |
| d | 104 | 95 | 83 | 66 |
The remainder of this table is filed in Teachers College Library, Columbia University.
[36]
| Nov., 1918 | June, 1919 | Nov., 1919 | June, 1920 | |
|---|---|---|---|---|
| Means | ||||
| Arithmetic Ratio | 89.02 | 97.16 | ||
| ±1.05 | ±1.07 | |||
| Vocabulary Ratio | 98.96 | 111.44 | 106.20 | 107.61 |
| ±1.48 | ±1.61 | ±0.90 | ±0.93 | |
| Reading Ratio | 96.47 | 101.96 | 98.98 | 100.60 |
| ±1.19 | ±1.18 | ±1.03 | ±0.97 | |
| Completion Ratio | 99.76 | 101.83 | 101.67 | 103.10 |
| ±1.11 | ±1.23 | ±0.93 | ±0.85 | |
| Standard Deviations | ||||
| Arithmetic Ratio | 12.03 | 12.53 | ||
| ±0.74 | ±0.76 | |||
| Vocabulary Ratio | 15.71 | 16.58 | 10.34 | 10.84 |
| ±1.05 | ±1.14 | ±0.64 | ±0.66 | |
| Reading Ratio | 12.63 | 12.14 | 11.82 | 11.36 |
| ±0.84 | ±0.84 | ±0.73 | ±0.69 | |
| Completion Ratio | 12.34 | 12.63 | 10.85 | 9.90 |
| ±0.82 | ±0.87 | ±0.67 | ±0.60 | |
| Correlations of Ratios | ||||
| Arithmetic and Vocabulary | .60 | .30 | ||
| ±.06 | ±.08 | |||
| Arithmetic and Reading | .70 | .64 | ||
| ±.04 | ±.05 | |||
| Arithmetic and Completion | .48 | .61 | ||
| ±.07 | ±.05 | |||
| Vocabulary and Reading | .34 | .32 | .57 | .47 |
| ±.08 | ±.09 | ±.06 | ±.07 | |
| Vocabulary and Completion | .45 | .36 | .53 | .54 |
| ±.07 | ±.08 | ±.06 | ±.06 | |
| Reading and Completion | .61 | .65 | .67 | .67 |
| ±.06 | ±.06 | ±.05 | ±.05 | |
[37]
In Table 12 are presented the Subject Ratios in the same order as the Quotients appear in Table 1.[15] There plainly is a rapid rise of SQ/IQ from period to period, excluding all pupils who did not take all tests and excluding Grade III; which includes all children taking all tests who were in school in June, 1920, and were Grade IV and above in November, 1918. The average AccR is 98.24 in November, 1918, and 102.78 in June, 1920. The average IQ for these children is 105.22. The S.DAccR₁₉₁₈ is 11.17; the S.D.AccR₁₉₂₀ is 9.09; the S.D.IQ is 19.24. It is obvious that the average amount of product per intelligence has increased, that the range of AccR’s has decreased (which means that factors causing disparities, other than intelligence, have been removed), and that the S.D. of the AccR’s is about one half the S.D. of the IQ’s. M’s are about equal so it is not necessary to use coefficients of variability. The variability of children, intelligence aside, is only one half what the variability is otherwise. The correlations when IQ = X, AccR₁₉₁₈ = Y and AccR₁₉₂₀ = S and when AccR = average of Vocabulary, Reading and Completion Ratios, are:[16]
| rX.Y. | = | -.602 |
| rX.S. | = | -.493 |
| rY.S. | = | +.549 |
The remaining disparity is then due to something which is in negative correlation with intelligence.
The number of cases here is only 48.
The P.E.’s are then as follows:
| P.E.M | P.E.S.D. | |
| X | 1.91 | 1.35 |
| Y | 1.11 | 0.79 |
| S | 0.90 | 0.64 |
| P.E.rX.Y. | = .06 | |
| P.E.rX.S. | = .08 | |
| P.E.rY.S. | = .07 |
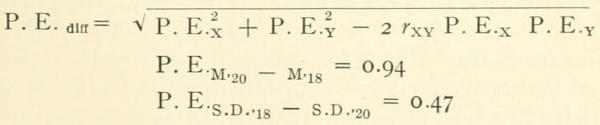
The differences between the M’s and between the S.D.’s of our 1918 and our 1920 AccQ’s; namely, 102.78 - 98.24 = 4.54 and 11.17 - 9.09 = 2.08, have formed a step in the argument. We must have the P.E.’s of these amounts in order to establish the reliability of the quantitative indices we employ:
P.E.diff = √P.E.X² + P.E.Y² - 2 rXY P.E.X P.E.Y
P.E.M₂₀-M₁₈ = 0.94
P.E.S.D.₁₈-S.D.₂₀ = 0.47
[38]
These differences are then reliable. If the same data were accumulated again in the same way with only 48 cases, the chances are even that the 4.54 would be between 3.50 and 5.48 and the 2.08 between 1.61 and 2.55. That there would be positive differences is practically certain, since the difference between the means is over four times as large as its P.E., and the difference between the S.D.’s over four times as large as its P.E.
To make still more certain this observation of positive amount in M of second testing minus M of first testing and in S.D. of first testing minus S.D. of second testing (AccR), which means an increase in central tendency of AccR’s and a decrease in spread of AccR’s under special treatment, we have listed in Table 13 the means and standard deviations of Subject Ratios of each test for each period and the intercorrelations of these Subject Ratios. These do not include exactly the same children in each period but are inclusive of all grades for all periods. They are a measurement of increased efficiency of the school as a whole, rather than of any one group of children; though, of course, the bulk of the children have representation in each of these indices. Too much continuity is not to be expected from June, 1919, to November, 1919, as the children are different. Comparison should always be from November to June.
These tables bear out the fact presented by AccR. It is clear that there is a marked development in the S.R.’s, both by increase of M. and decrease of S.D. The decrease of correlation between S.R.’s is not so marked, but neither is the negative correlation between AccR and IQ much less in June, 1920, than in November, 1918. The association of achievements in terms of intelligence is very probably due to mistreatment, since it is in negative correlation with IQ, as a general inherited ethical factor could not be.
We will note that the Arithmetic Ratios are in as high positive association with the Reading Ratios as the Vocabulary Ratios are with the Reading Ratios. This makes it highly improbable that the intercorrelation of these remnants is due, to any large extent, to common elements in the test or to specific abilities. The common interassociation of all Ratios seems to point to the operation of some common factor other than intelligence as a determinant of disparity in school progress. It would be easy to identify this as the part of Burt’s “General Educational Factor” which is not intelligence—that is, industry, general perseverance and initiative—were [39]it not for the fact that this same influence stands in negative association to intelligence. It is our belief that it is the influence of a maladjusted system of curricula and methods which accounts for these rather high interassociations of achievements, irrespective of intelligence.
The association of abilities in arithmetic, reading, and completion with intelligence is markedly raised by special treatment. Disparities of educational product are therefore to a great extent due to intelligence. (Tables 2, 3, 5, 7, 8, 9, 10 and 11.)
The remnants (intelligence being rendered constant by division of each SQ by IQ) intercorrelate about .5. If there were specialized inherited abilities, these intercorrelations would not all be positive nor would they be as uniform. (Tables 6 and 13.)
The averages of these remnants, for reading, vocabulary, and completion, correlate -.61 in 1918 and -.49 in 1920 with IQ. These remnants are in negative association to intelligence. If the intercorrelations of these remnants were due to a “General Factor,” this correlation would not be negative.
Therefore intelligence is far and away the most important determinant of individual differences in product.
As part of the relation between tests, irrespective of intelligence, is due to common elements in the tests, this reasoning becomes still more probable.
General factor in education, as distinct from intelligence, has not been separated here from inherited bases of ambition, concentration, and industry. It seems out of our province to conjure up some inherited complex of abilities other than intelligence, specialized inherited abilities, or proclivities and interests tending to thorough prosecution of school work. I have therefore meant this last by the general factor.
McCall has correlations varying continually in size from -.63 to +.98 between various measurements of a group of 6B children.[17] The abilities involved were not pushed as are those considered here. Some of the low correlations are no doubt indications of low association because of the way children are, not the way they might be [40]by heritage; still others, such as handwriting and cancellation (unless bright children do badly in cancellation tests because they are more bored than the others), are correlated low or negatively with intelligence when the correlation is at its maximum. Such results as those of McCall serve as a guide not to argue about other tests by analogy. It is necessary to find which traits and abilities can be pushed to unity in their relation to intelligence and which, like handwriting, are practically unrelated to general mental power.
It is well to know about music tests and such tests as Stenquist’s mechanical ability test when the correlation with intelligence is pushed, before we decide whether the quality measured is a manifestation of specific talent or general intelligence.
Cyril Burt obtained data much like that presented here except that instead of getting rid of the influence of intelligence and finding determinants for the remnants of disparity, he built up a hierarchy of coefficients as they would be if they were due entirely to a common factor and compared these with his obtained r’s. I will present his conclusions with regard to a general factor which are in substantial though not complete agreement with those advanced here.
“Evidence of a Single Common Factor.
“The correlations thus established between the several school subjects may legitimately be attributed to the presence of common factors. Thus, the fact that the test of Arithmetic (Problems) correlates highly with the test of Arithmetic (Rules) is most naturally explained by assuming that the same ability is common to both subjects; similarly, the correlation of Composition with Arithmetic (Problems) may be regarded as evidence of a common factor underlying this second pair; and so with each of the seventy-eight pairs. But is the common factor one and the same in each case? Or have we to recognise a multiplicity of common factors, each limited to small groups of school subjects?
“To answer this question a simple criterion may be devised. It is a matter of simple arithmetic to reconstruct a table of seventy-eight coefficients so calculated that all the correlations are due to one factor and one only, common to all subjects, but shared by each in different degrees. Such a theoretical construction is given in Table XIX. In this table theoretical values have been calculated so as to give the best possible fit to the values actually obtained in [41]the investigation, and printed in Table XVIII. It will be seen that the theoretical coefficients exhibit a very characteristic arrangement. The values diminish progressively from above downwards and from right to left. Such an arrangement is termed a ‘hierarchy.’ Its presence forms a rough and useful criterion of the presence of a single general factor.
“On turning to the values originally obtained (Table XVIII.) it will be seen that they do, to some extent, conform to this criterion. In certain cases, however, the correlations are far too high—for instance, those between Arithmetic (Rules) and Arithmetic (Problems), and again Drawing and both Handwork and Writing (Quality). Now these instances are precisely those where we might anticipate special factors—general arithmetical ability, general manual dexterity—operating over and above the universal factor common to all subjects. These apparent exceptions, therefore, are not inconsistent with the general rule. Since, then, the chief deviations from the hierarchical arrangement occur precisely where, on other grounds, we should expect them to occur, we may accordingly conclude that performances in all the subjects tested appear to be determined in varying degrees by a single common factor.
“Nature of the Common Factor.
“What, then, is this common factor? The most obvious suggestions are that it is either (1) General Educational Ability or (2) General Intelligence. For both these qualities, marks have been allotted by teachers, quite independently of the results of the tests. The correlations of these marks with performances in the tests are given in the last two lines of Table XVIII.
“Upon certain assumptions, the correlation of each test with the Hypothetical Common Factor can readily be deduced from the coefficients originally observed. These estimates are given in the last line but two of the table. They agree more closely with the observed correlations for General Educational Ability, especially if the latter are first corrected for unreliability. (Correlations: Hypothetical General Factor coefficients and General Educational Ability coefficients .86; after correction .84. Hypothetical General Factor coefficients and General Intelligence coefficients .84; after correction .77.) We may, therefore, identify this hypothetical general factor with General Educational Ability, and conclude [42]provisionally that this capacity more or less determines prowess in all school subjects.
“The high agreement of the estimated coefficients with the intelligence correlations suggest that General Intelligence is an important, though not the only factor in General Educational Ability. Other important factors are probably long-distance memory, interest and industry. It is doubtless not a pure intellectual capacity; and, though single, is not simple, but complex.”[18]
[43]
Schools of to-day are organized and administered so as to yield less chance to a child to obtain as much information as is possible for him to have in direct proportion to his mental ability. The correlation between accomplishment and intelligence (using AccR, the average of Reading, Vocabulary, and Completion Ratios with IQ) was -.61 in November, 1918, and -.49 in June, 1920, in the Garden City public school. The regrading and special promotion work from November, 1918, to June, 1920, reduced the handicap of brightness, but could not obliterate the sparsity of returns per increment of capacity in the upper reaches of the intelligence. Further, work along this same line done by A. J. Hamilton in the Washington School, Berkeley, California, indicates that this was not a peculiarity of the school at Garden City.
The wide range of abilities which we know exists in pupils of any one age makes it impossible to adjust our formal education to the extremes. Much adjustment has been made in favor of the lower extreme, but little has been done for our genius. Of course the work with extreme subnormals is conceived and prosecuted more in the sense of clearing them away for the good of those remaining than of fitting education to their own needs. We are neglecting, however, our duty to those whom nature has endowed with the essentials of leadership. They do not interfere quite as much with ordinary classroom procedure, but they are greater social assets and need special treatment to develop them rather than to let others develop better.
Neither of the extreme groups is certain of getting the normal stamina necessary for good citizenship. Neither group forms good habits of study nor accumulates such information as it might. Being aware of this discrepancy between the gift and the recipient, we have made our lessons easier and we have segregated the lower percentile. There is much more to be done. We must adapt [44]education to at least five varying classes in order to reduce the spread within each to a commodious span. But the genius is the most important and should have the greatest claim to our immediate attention.
First, our social needs demand special attention for the genius in order that we may better exploit our best nervous resources. Second, our educational needs demand it since the very bright as well as the very stupid disrupt calm and cogent classroom procedure. Third, they themselves demand it in order that they may, even when they do function as leaders, be happier in that function, since now they often lose much in social contact by peculiarities which prevent an integration of their “drives” into a harmonious economy of tendency. These peculiarities come from their continuous maladjustment, since when they are with children of their own mental maturity they are physically and physiologically handicapped; when they are with children of their own size and muscular equipment they are so far mentally superior that they are unhappily adjusted. Only classification on a large scale will allow sufficient numbers of them to congregate to correct this.
I am reminded of a boy ten years old whose IQ on the Terman test was 172. He defined a nerve as the “conduction center of sensation” and, when asked to explain, did so in terms of sensation of heat and motive to withdraw. He explained the difference between misery and poverty thus: “Misery is a lack of the things we want; poverty is a lack of the things we need.” How can we expect a boy like this to grow into a normal citizen if we do not provide the companionship of peers in mentality and in physique?
Fourth, our eugenic needs demand it, since we are not conserving this, our chiefest asset, genius. Unless we conserve better these rare products, the standard deviation of the intelligence of humanity will keep shrinking as we select against imbeciles and against genius as well. The waste of a genius who becomes an intellectual dilettante, as many now in fact do, is double. We lose what he might do for society; he does not marry and we lose the potentiality of his highly endowed germ-plasm.
And they do become dilettantes when special treatment is not given. I know of a young man who was first of his high-school class, who got all A’s his first year in College (at Wisconsin), and all A’s his second year (at Harvard); and then he began to read all manner of literature with no schema of expression, no vocation, [45]because, as he said, all college courses are so stupidly easy. He attended no lectures and read none of the books in one course, and then two days before the examination he was taunted with not being able to pass this course. He spent two nights and two days studying, and he received B in the course. But now he is a failure because he has no organized, purposive schema of expression; he was always in classes with people less fortunately endowed than he, and so he never had a chance.
On these four counts then we must segregate our genius: (1) Social exploitation of our resources. (2) Educational procedure for the sake of other children as well as for them. (3) Happiness for them, organization of their trends, and formation of social habits. (4) Biologic conservation of great positive deviation from average human intelligence.
This genius is of various kinds, political and business leaders, scientists and artists. Have they then the same inherited nervous structure with regard to abilities and capacities as distinct from interests? We know that they must have something in common, something that we call intelligence, power of adaptation. Calling this the nervous chemistry, the way the nervous system acts its quality, we must still know whether we have also an inherited nervous physics to deal with, or a further inherited nervous chemistry which predisposes to specific ability. Are there inherited capacities or predispositions to ability? We are in a position to answer this question with regard to the elementary school subjects, and are tempted here into a more general discussion of the matter in hand.
The need to clarify our view on what is inherited and what is due to environment can be clearly envisaged in terms of our teachers. Whatever psychologists may mean by “predisposition to ability” it is quite certain that teachers make no distinction between this and the inheritance of a capacity. They feel that some children figure better than they read, and others read better than they figure, “by nature,” and there their obligation ends. If it is a grave matter that we shoulder the burden of bringing a child to his optimum achievement, then it is an immediate duty that we find how much of the failure to produce product of one kind or another is due to unremovable factors, and how much is due to our inadequacy. [46]So, too, we have much loose discussion about finding out what children can do and want to do in the way of vocational diagnosis,—loose because it assumes that children are born with definite vocational capacities. Certainly we can do much more in the way of development and much more in the way of preparation for social needs if we know just how much “predisposition to ability” means. The teacher interprets it to mean about what was meant by the turtle that held up Atlas who held up the world. She makes no real distinction between predisposition to ability and specific ability, just as there was no real causal distinction between the turtle and Atlas. She then gets at her conception of intelligence additively,—a summation of school abilities.
The correlation of teachers’ judgment of “power of adaptation,” carefully explained, and marks given six months previously by the same teachers was .82. The correlation of this same average judgment with the average of thirteen intelligence tests was only .58. These teachers obviously reached their conclusions of the intelligence of a child in the same way as they reached their conclusions of what marks he earned in their subjects.
The unit characteristics which make up what we describe in terms of gross behavior as intelligence must of course be many. No one denies that if we knew just what these units were we could describe two possible manifestations of what we now call intelligence, of which one person could do one only and another person could do the other only because of the particular combinations of the units inherited. This would constitute inheritance of predisposition to special capacities. But it is not the same to assume that the vocations and aptitudes desirable in a world such as ours have specialized inherited bases. It is far more probable that substantially the same inherited characteristics are necessary to success in all the gross cross-sections of behavior which we call vocations and abilities.
As the unit characteristics are certainly not so closely allied to our social needs as “mechanical intelligence” and “social intelligence” or even “rote memory for numbers,” we may not even distinguish presence of any five hundred elements from presence of any other five hundred elements in terms of what we now measure as intelligence. It is just as likely that all the elements of intelligence are necessary for every vocation and that all contribute to success of any one kind as it is likely that some are necessary for one vocation and others for another.
[47]
This is a question of more or less. I believe that the amount to which a person’s specific talents, his vocation as distinct from his general power, are shaped by the combinations of elements which make up his inheritance, is much less than believed by Francis Galton, who says: “There cannot then remain a doubt but that the peculiar type of ability that is necessary to a judge is often transmitted by descent.” And again: “In other words, the combination of high intellectual gifts, tact in dealing with men, power of expression in debate, and ability to endure exceedingly hard work, is hereditary.”[19]
I believe that the amount of influence which inheritance has upon the kind of thing a man does in life has been overestimated; that the inherited factors influence more the way in which he shall do whatever the environment influences him to do. This leaves plenty of play for the close correlation between parents and children in both intelligence and vocation. The former is the result of inheritance, the latter is the result of environment. All competent psychologists would agree to-day to less specific inheritance than a basis, for instance, for the distinction in vocation of minister and orator; and more specific inheritance than for such a statement as “We inherit how well we will do, we learn what we will do.” There would be substantial agreement to the statement that the inherited nervous bases of a very intelligent plumber are more like those of a very intelligent statesman than like those of a stupid plumber. This question is, how much inheritance we can conceive of as being made up of neuro-chemical elements determining us to do one kind of a thing rather than another.
Interpretation statistically of one thousand possible elements, simply viewed as present or absent, and again simply viewed only as combinations and not permutations, would mean that the less the intelligence the more specific the inheritance. The most intelligent man alive could, by what he is born with, do anything since he has all of the one thousand factors, all of which help him in the prosecution of any venture. But the fewer elements he has the less well he does most things, and when lacking certain elements he has lost the capacity to do some things more completely than others. (I have neglected physiological characteristics necessary to an ability. A deaf man certainly is handicapped in music. I speak [48]of possible mental capacities.) Such a view leaves scope for some degree of special abilities. It accounts for the idiot-savants, it accounts for the cases where genius is diverse as well as where it is not though it would demand that specialized genius be very rare and that inherited specialization be much rarer in the upper than in the lower reaches of intelligence. It allows for such cases as Galileo, whose father was a composer, as well as the cases cited by Galton. Heredity need not imply the same kind of genius though it does suggest it, whereas the environment backs up this inherited implication. We further can here absolutely resent an inheritance of such things as ability in the common school subjects without being involved in a view to deny the inheritance of a predisposition to mechanical rather than musical successes.
Observation of brilliant children would corroborate this view. They can do anything. Observation of the mentally deficient is equally encouraging to this view. It has always been puzzling that they seem to do a few things much better than others. According to this conception there would be a negative correlation between intelligence and specialized inheritance.
We will then consider each inherited element, not as music or as science, but rather as an element of intelligence which will help in all lines of work, but which may be a little more necessary for some than others. This is a predisposition in a true sense. If a man had only one element out of one thousand, he could do only a few things. If he had all thousand he could do everything. Inheritance of ability is not in terms of units valuable to us socially, but only in terms of undefined nervous elements; and we may conceive of specialization, and still hold that there be less, the more intelligent a man is.
To make the matter still more concrete, imagine two men each of whom have 900 of the hypothetical 1000 elements, this being a value of +3 S.D. from the mean intelligence of the human race. One is a composer, the other financier. According to this view the greatest number of their inherited bases on which they could differ would be 100 of the 900 elements. The other 800 must be alike. Assuming that all of the elements contribute to all of the activities, but that some of them are more essential to some activities than to others, we could in this case say that the 100 which are different decided in some measure the vocation of each man. But it is much more probable that they overlap in 850 and that each [49]has only 50 distinct elements, and further that the 50 which are distinct in each would not all be such as to influence one kind of ability rather than another. Then these two men, had they interchanged environments, would probably have interchanged vocations in that transaction. For the purposes of this discussion we treat physiological inherited features (such as hearing), as environment, as we are considering the mental capacity of composer as distinct from the necessary conditions to its development. According to this view, then, we account easily for the versatility of genius, which is so apparent in such accounts as Terman’s The Intelligence of School Children.[20] Also, though very infrequent, we account for the genius who could not have done other things as well as those he did.
Let us consider the case of negative deviates, say 3 S.D. from the mean intelligence of the human race. Two men each have 100 of the 1000 hypothetical elements. It is much more probable here than not, that an appreciable amount of the 100 elements would be distinct in each person, though it is improbable that they would often be such as to form the basis of an “ability.” This then would account for specific abilities amongst morons and also for the presence but rarety of idiot-savants. Also since there are a limited number of such combinations possible and since many overlap for all practical purposes, we would account for the common likenesses as well as the relatively more uncommon extreme differences. This view is consistent with an examination of the data of this thesis which are contrary to the common belief in special abilities or to a view of inheritance of units which are actually the goals of education and the uses of a civilization too recent to leave its imprint on inheritance. We found no unremovable predispositions to one school subject more than to the others in any of the children. We would thus argue that such predispositions as to mathematics or to oratory are extremely rare and cannot be used as rules by which to interpret human nature.
Woodworth says in a criticism of McDougall’s view of instincts: “What he here overlooks is the fact of native capacities or rather, the fact that each native capacity is at the same time a drive towards the sort of activity in question. The native capacity for mathematics [50]is, at the same time, an interest in things mathematical and in dealing with such things. This is clearly true in individuals gifted with a great capacity for mathematics.”[21]
I do not wish to become involved here in a discussion of the original nature of man on the instinctive side. I wish merely to rebel at the assumption of specific inheritance of abilities that are really sociological units. Mathematics is an ability which is useful to us, which we have come to encourage in education. But it is a man-made unit. There is no reason to believe that the inherited components of mentality are in any direct way related to such talents as mathematics or music. The units may vaguely predispose, but the units are not mathematics and music. We may say that the inherited physical and chemical units of the nervous system may be so distributed as to predispose one man to mathematics, and another to music, but we must not argue for inherited interests as correlates. The evidence is all that the inherited nervous chemistry of the individual is what on the side of behavior, we define as intelligence—power of adaptation. We may logically fall back on the inheritance of predisposition to ability, meaning thereby the inheritance of such nervous qualities as will better fit the individual to cope with mathematical than with musical situations; but if we adopt this cautious ground in disputation we cannot argue in another matter for an inherited interest in mathematics, innate because of the inborn mathematical talent. If the inherited qualities merely predispose they merely delimit; just as a man born without arms would probably not become a great baseball player, nor a deaf man a great musician, nor a man with poor motor control a skilled mechanic—so we are predisposed nervously for capacities. Hence can we argue that the inborn root of the interest is the capacity? Is it not safer to assume that interests in success, approval of fellowmen and general mental activity led to the development of the capacity by virtue of a favorable environment, and led by the same environment to interests centered about its activity?
It is far from my intention to say that inheritance is not as specific nervously as it is in matters of blood pressure and texture of skin. As we, in our limited knowledge, still define abilities in terms of behaviour and not by nervous elements, my contention is [51]that intelligence should be regarded as the sum total of this inheritance, much as general strength is, in terms of the body. We have still to find the component units of this intelligence. We can then define predisposition to ability. To split intelligence into inherited units of mathematics, reading, composition, mechanics, etc., is as unjustifiable as to split inherited vigor of body into baseball capacity, running capacity, climbing capacity, etc. Mathematics and music are what we do with intelligence, not what intelligence is made of. Of course everyone agrees to this. The lack of emphasis upon the chance that the inherited units are general in their application, that the same inherited elements are involved in many of the behavior complexes which we call traits and abilities, is what confuses the situation.
We must know what these elements are, and how many contribute to which capacities. Then we can decide the question of specialized inheritance. In all crude behavior data it is impossible to separate the influence of nature and nurture. A theory of specialized inheritance will inevitably infringe upon common sense in its claims. Of the following statements, it would be easier for most of us to endorse 1 and 2 than 3 and 4, whereas few would agree with 5 and 6.
1. “Unless one is a blind devotee to the irrepressibility and unmodifiability of original nature, one cannot be contented with the hypothesis that a boy’s conscientiousness or self-consciousness is absolutely uninfluenced by the family training given to him. Of intelligence in the sense of ability to get knowledge rather than amount of knowledge got, this might be maintained. But to prove that conscientiousness is irrespective of training is to prove too much.” (Thorndike, Educational Psychology, III, pp. 242.)
2. “Some attempts have been made to apply these laws to behavior complexes, but as yet psychology has provided little foundation for such studies. The most thorough-going attempts have been made with human mental traits and some evidence has been collected here in favor of the view that differences in the instinctive behavior of individuals are inherited according to Mendelian ratios. But in the field of human psychology too little is known of the genesis of character, of the distinction between nature and [52]acquired behaviour to provide a very firm foundation for the work of the geneticist.” (Watson, Behaviour, p. 156. Italics are mine.)
3. “Even, however, when we omit the trades as well as the cases in which the fathers were artists, we find a very notable predominance of craftsmen in the parentage of painters, to such an extent indeed that while craftsmen only constitute 9.2 per cent among the fathers of our eminent persons generally, they constitute nearly 35 per cent among the fathers of the painters and sculptors. It is difficult to avoid the conclusion that there is a real connection between the father’s aptitude for craftsmanship and the son’s aptitude for art.
“To suppose that environment adequately accounts for this relationship is an inadmissible theory. The association between the craft of builder, carpenter, tanner, jeweller, watchmaker, wood-carver, rope-maker, etc., and the painter’s art is small at the best and in the most cases non-existent.” (Ellis, quoted in Thorndike, Educational Psychology, III, p. 257.)
4. “—the statesman’s type of ability is largely transmitted or inherited. It would be tedious to count the instances in favor. Those to the contrary are Disraeli, Sir P. Francis (who was hardly a statesman, but rather bitter a controversialist) and Horner. In all the other 35 or 36 cases in my Appendix, one or more statesmen will be found among their eminent relations. In other words, the combination of high intellectual gifts, tact in dealing with men, power of expression in debate and ability to endure exceedingly hard work, is hereditary.” (Galton, Hereditary Genius, pp. 103, 104.)
Thorndike comments on this last quotation: “Of course there is, in the case of all of Galton’s facts the possibility that home surroundings decided the special direction which genius took, that really original nature is organized only along broad lines. Moreover, it is difficult to see just what in the nervous system could correspond to a specialized original capacity, say, to be a judge. Still the latter matter is a question of fact, and of the former issue Galton’s studies make him the best judge. We should note also that it is precisely in the traits the least amenable to environmental influence such as musical ability, that the specialization of family resemblance is most marked.”
This cautious and sagacious commentary is in marked contrast to the following:
[53]
5. “But no training and no external influence can entirely supersede the inborn tendencies. They are the product of inheritance. Not only unusual talents like musical or mathematical or linguistic powers can be traced through family histories, but the subtlest shades of temperament, character and intelligence can often be recognized as an ancestral gift.” (Munsterberg: Psychology, General and Applied, p. 230.)
6. “Statistical studies which covered many characteristic opposites like industrious and lazy, emotional and cool, resolute and undecided, gay and depressed, fickle and constant, cautious and reckless, brilliant and stupid, independent and imitative, loquacious and silent, greedy and lavish, egoistic and altruistic and so on, have indicated clearly the influence of inheritance on every such mental trait.” (Munsterberg, Psychology, General and Applied, p. 237.)
Undoubtedly Munsterberg here refers to the data accumulated by Heymans and Wiersma since they used such opposites as these, and also used what might be called statistical methods. Speaking of the same data Thorndike says:
“In view of the insecurity of their original data it seems best not to enter upon an explanation of their somewhat awkward method of measuring the force of heredity, and not to repeat the figures which are got by this method. Also they do not attempt to estimate an allowance for the influence of similarity in home training, though they state that some such allowance must be made.” (Educational Psychology, III, p. 262.)
Hollingworth and Poffenberger, commenting on the data of Galton and Ellis mentioned in the quotation above, say:
“Francis Galton has made a statistical study of the inheritance of specified mental abilities and found that the abilities required for success as a judge, statesman, minister, commander, poet, artist, and scientific man, are inherited. But the nature of his data makes him unable to make exact allowances for influences of training and environmental influences. Consequently, his figures might really show general intelligence to be inherited and the form of its expression to be dependent upon environment.
“Other investigators, among them F. A. Woods and Havelock Ellis, have made similar statistical studies and conclude that there is inheritance of even such qualities as temper, common sense, and the like, but these reports are also subject to the same [54]complicating influence of environment.” (Applied Psychology, p. 43.)
It can readily be seen, from these quotations, that there is fundamental disagreement among psychologists with regard to the inheritance of specific ability,—fundamental disagreement in three ways: (1) Interpretation of Galton’s and Ellis’s data. (2) Opinion on the matter. (3) Degree of precision possible in giving judgment.
We have noted that it is very difficult to understand what the neural bases for such special abilities as Galton speaks of could be; that they are social, not neural or psychological units. A view of a large number of inherited elements all of which contribute to what we call general intelligence and each of which is slightly more necessary to some vocation than others, would account for all the observed facts, is neurally imaginable, and does not need to view ability to be a “judge” or “artistic talents” as biological entities. It further explains the differences in their limited abilities of mentally deficient children.
Burt says in this connection: “Among children of special (M.D.) schools, the evidence for a general factor underlying educational abilities and disabilities of every kind is not so clear. In administrative practice, ‘mental deficiency’ implies among different children deficiencies in very different capacities, both general and specific.” (Cyril Burt: The Distribution and Relation of Educational Abilities, p. 83.)
For these reasons it is justifiable to attempt to present evidence of the inheritance of school abilities with a view to showing that school abilities are not dependent upon special inherited aptitudes, as teachers so often assume, but that general intelligence is the only inherited cause of disparity in product. Investigations where the correlation between educational product and intelligence, irrespective of chronological age, was less than around .75, used data where many removable causes were not removed, and consequently measured results of the environment as well as heredity. A case such as this follows:
“The influence of inheritance upon a very specific mental quality, namely, spelling ability, has been tested experimentally, although here there is some difficulty in separating the influence of heredity from that of environment. Earle studied the spelling ability of 180 pairs of brothers and sisters who had uniform school training [55]and found a correlation of .50. This means that if one child deviated by a certain amount from the average child in spelling ability, his brother or sister would deviate from the average child just half as much; that is, he would resemble his brother or sister to that extent.” (Hollingworth and Poffenberger: Applied Psychology, p. 44.)
The data presented in this thesis indicate that that correlation could have been pushed as high as the r between the intelligence of the pairs of brothers. In other words, a child could be made to resemble his brother as nearly in spelling ability as he did in intelligence. All disparity could be reduced to that of general intelligence. Then intelligence alone is inherited as far as the data here presented have any bearing on the matter in hand. The influence of environment is in this case a matter of no consequence, since the subjects all had the same schooling, and home influence does not as a rule teach children to spell; but the data are not irrespective of the influence of intelligence.
Table 3 presents intercorrelations between IQ and quotients in the various subjects. The correlations are in each instance irrespective of chronological age since all quantitative indices are expressed as quotients. We have seen that they go up from September, 1918, to June, 1920. Every possible means was used to push these correlations to their limit, to remove all removable factors. We have seen that the data show here, as in Tables 7 and 8, that there is little association between traits which is not a result of differences in intelligence. Table 3 shows the same 48 children throughout. The r’s are not corrected for attenuation. Though the r’s are high throughout and go higher under special treatment, the association can still be more accurately registered by some attention to relation of the means and the S.D.’s. Two traits to be identical must have r = 1.00 S.D.x = S.D.y and Mx = My. We have seen that the r increases, M-M decreases and S.D.-S.D. regardless of sign decreases. (Tables 9, 10 and 11.)
But as the S.D.’s of the Subject Quotients (though they do approach S.D. of IQ) sometimes go below the S.D. of IQ, we must know why. It is because the low IQ’s do better per their intelligence than the high IQ’s. We have seen above that the correlation between IQ and average of the Vocabulary, Reading, [56]and Completion Subject Ratios is -.61 in November, 1918, and -.49 in June, 1920.
Then the ratio of achievement to intelligence is in definite relation to intelligence—a negative relation. It is this same tendency to adapt our education to a low level which has prevented a perfect association between intelligence and the various subjects. The relation of one subject to another, irrespective of intelligence, would be zero if there were no other factors except intelligence responsible for the product. After two years of such attempts as an ordinary public school will allow, we have removed many of the causes of disparity and increased the association between potential progress and progress in arithmetic, reading and language. The correlations, correspondence of S.D.’s, and Σ(IQ-EQ)/n registered in Tables 9, 10, and 11 give evidence of this as does also the increase in the AccR, an average of the Arithmetic, Reading, Vocabulary and Completion Ratios. (Table 13.)
Are the unremoved causes other than intelligence unremovable? These causes might be, besides the unreliability of tests and the common elements in the tests, the specialized inheritance we have considered, ethical qualities of endurance, ambition, initiative and industry or a general factor. The correlations between Arithmetic Ratios and Reading Ratios and the other intercorrelations of Subject Ratios will yield us an index of how much of this remaining disparity is due to specialized inheritance. These intercorrelations for all years are embodied in Table 13. The partial correlations of quotients when intelligence is rendered constant will be found in Table 6. These intercorrelations, and the partials as well, give an indication of some general factor other than intelligence since the r’s irrespective of intelligence are uniform and all are positive. Only the correlation of arithmetic with vocabulary, intelligence being rendered constant, goes to zero. Though this might be due in part to common elements in the tests, it is more likely that there is another factor in operation. Inheritance of specific abilities could not have this uniform effect on the correlations.
These correlations all being positive and the r’s being very uniform, both correlation of ratios and the partials, makes the interpretation of specialized inheritance of ability extremely unlikely. The correlation of Arithmetic Ratios with Reading [57]Ratios is higher in 1920 than that of Vocabulary Ratios with Reading Ratios. It leaves the possibility that the unremoved factors are inherited ethical differences or that they are a “general educational factor.” The negative correlation of AccR with intelligence, however, being as high as these positive remnants of interrelation, would tend to make more probable an interpretation of this as a remnant of disparity, intelligence accounted for, which is entirely due to the organization of our schools.
All disparity not due to intelligence was worked on as far as it was possible. Thereupon the association of intelligence and educational product increased markedly and the negative association of intelligence with achievement in terms of intelligence decreased somewhat. However, some association of abilities not due to intelligence remains. Exactly as much negative association of achievement in terms of intelligence, with intelligence, remains. So, when some of the disparities due to the environment have been removed and therefore the correlation of Arithmetic Ratio with Vocabulary Ratio and Reading Ratio has been decreased, the causes which contributed to a correlation such as lack of interest having been removed, there still remains some relation of school qualities. But there also still remains a negative association between this accomplishment and intelligence which means that we still have a remnant of such removable influence as is due to badly adjusted curricula.
This enables us to interpret our partials. The partials are not nearer zero because although we have partialed out the effect of intelligence, we have not partialed out the factor which controls the negative relation to intelligence of these very partial resultants, since that is the effect of the methods and curricula. Though we did advance bright pupils and give them more chance, we have not given them a chance proportionate to the stupid children. And that is true since we often wanted to advance pupils and were not allowed to; whereas we were never allowed to demote pupils except in particular subject matter. The stupid children were always at the frontier of their intelligence at the educational cost of the others.
It is this remnant which has usually been interpreted as “general factor” or as inherited factors basic to initiative, ambition, and industry. The fact of importance is that these remnants, these marks of children independent of their intelligence, are associated [58]negatively with intelligence to the same degree that they are associated positively to each other. Unless we wish to assume that the “general factor” or the inherited bases of initiative and industry are associated negatively with intelligence we must account for the remnant in some other way. It seems far more reasonable to attribute this remaining association to the educational handicaps of intelligence which we were unable to remove.
The original tendencies of man, as distinct from his original equipment, have not been considered in this study. If the quantitative differences in endowment of this kind were added to the denominator of our accomplishment ratio formula, we would have a better measure and better results. We share in this investigation a general limitation of educational psychology—the requisite technique to measure individual differences of instincts and the ethical traits of which they are the predisposition. Industry, ambition, and initiative are not inherited units. They are, however, the rules of an economy of expression and as such are dependent upon individual differences in strength of instinct.
1. IQ can be used as a limit of school achievement expressed as SQ.
a Progress in Σ(IQ-SQ)/n may be used as a measure of school efficiency.
b SQ/IQ may be used as a measure of individual efficiency.
2. Correlations between intelligence and achievement are very different before and after the abilities are pushed.
a Many r’s are reported where conclusions are drawn as though they had been pushed. These conclusions should be restated.
b Intelligence and achievement are far more closely associated than has been assumed to date.
3. Disparity of school product can be reduced to individual differences in intelligence.
a Little specific inheritance of school abilities.
[59]
b Little unremovable difference in industry, conscientiousness and concentration.
c Intelligence is the only inherited general factor.
4. Negative association between AccR and IQ.
a To-day’s educational procedure involves a handicap to intelligence.
b The genius has been neglected.

[1] Part of this section is reprinted with revisions from Teachers College Record, Vol. XXI, No. 5 (November, 1920).
[2] For scientific purposes we want year-month means and standard deviations, that we may say that Charlie Jones is 2.1 S.D. above the mean for his age level, while Harold Smith is .1 S.D. below that mean. It is in terms such as these that we may be able to compare accomplishment in one function with accomplishment in another, progress in one with progress in another. For many of our problems we need a common denominator of measurement so that we may compare progress between tests and age-groups. The best common denominator is, I believe, S.D. in an age-group. Thus we may locate a child in any age-group in any test and compare that location with the position of any other child in any other test in his age-group.
For practical purposes, however, it is for many reasons more convenient to use quotients in elementary schools. Principals would rather deal with quotients since it is easier to explain them in terms of attainment and capacity. It is the use of such quotients that this thesis discusses.
[3] Judd, C. H., “A Look Forward,” in Seventeenth Yearbook, Pt. II, of the N.S.S.E., 1918.
[4] When the disadvantages of “pushing” children are discussed, the disadvantages of keeping children at their chronological age levels should be considered as well. Although it is true that a supernormal child placed in that grade for which he is mentally equipped loses much in social contact, it is also true that he loses a great deal by remaining in the grade where he physiologically belongs. There he develops habits of conceit, indolence, and carelessness. It is in all cases much better to group intelligent children and enrich the curriculum than to “push” them; but pushing may be better than leaving them where they belong by age. It is a possibility worth considering that the explanation of the “peculiarities” of genius lies in the fact that he has never associated with equals. When his fellows are mentally his equals they are physically far older and when they are physically his equals they are mentally inferior.
[5] Whether only the Accomplishment Ratio as a percentage should be given the parents, or whether they should know both the IQ and all the SQ’s, is a question on which I am not prepared to give an opinion. I incline to believe that the parents should know only the final marks and am sure that I advise telling the children these only.
[6] There will be reported elsewhere a fuller consideration of this aspect of the technique of derivation of norms, together with a complete presentation of the data used to obtain the age norms herein used.
[7] “The Accomplishment Quotient,” Teachers College Record, November, 1920.
[8] Or the ratio of the Subject Quotient to the Intelligence Quotient, which is the same as the ratio of the Subject Age to the Mental Age.
[9] This table is too bulky for complete publication but may be found on file in Teachers College Library, Columbia University.
[10] The remainder of this table is filed in Teachers College Library, Columbia University. Decimals are dropped in this table.
[11] Decimals are dropped in this table.
[12] Truman L. Kelley: Statistics, The Macmillan Co.
[13] This correlation was obtained by correlating one half of the Binet against the other one half and then using Brown’s Formula to determine the correlation of a whole Binet against another whole Binet.
[14] These quantities do not decrease because a perfect score on the arithmetic test was too easy to obtain at this time. The children had reached the limits of this test.
[15] Table 12 is too bulky for complete publication. The first page is reproduced here and the complete table is filed at the library, Teachers College, Columbia University.
[16] No arithmetic was given in 1918, therefore arithmetic was not used in these averages.
[17] William Anderson McCall: Correlations of Some Psychological and Educational Measurements, Teachers College Contributions to Education, No. 79.
[18] Cyril Burt: The Distribution and Relations of Educational Abilities, pp. 53-56.
[19] Quotations from Galton: Hereditary Genius, ’92, pp. 61-62 and pp. 103-104.
[20] Terman, Lewis: The Intelligence of School Children. Boston: Houghton Mifflin, 1919.
[21] Woodworth, R. S.: Dynamic Psychology, p. 200. New York: Columbia University Press, 1918.